Breakdown
Drill into per-question completion rates, answer distributions, and result outcomes. Use this to identify which questions cause the most drop-offs, which answers are most popular, and how your audience's results are distributed.
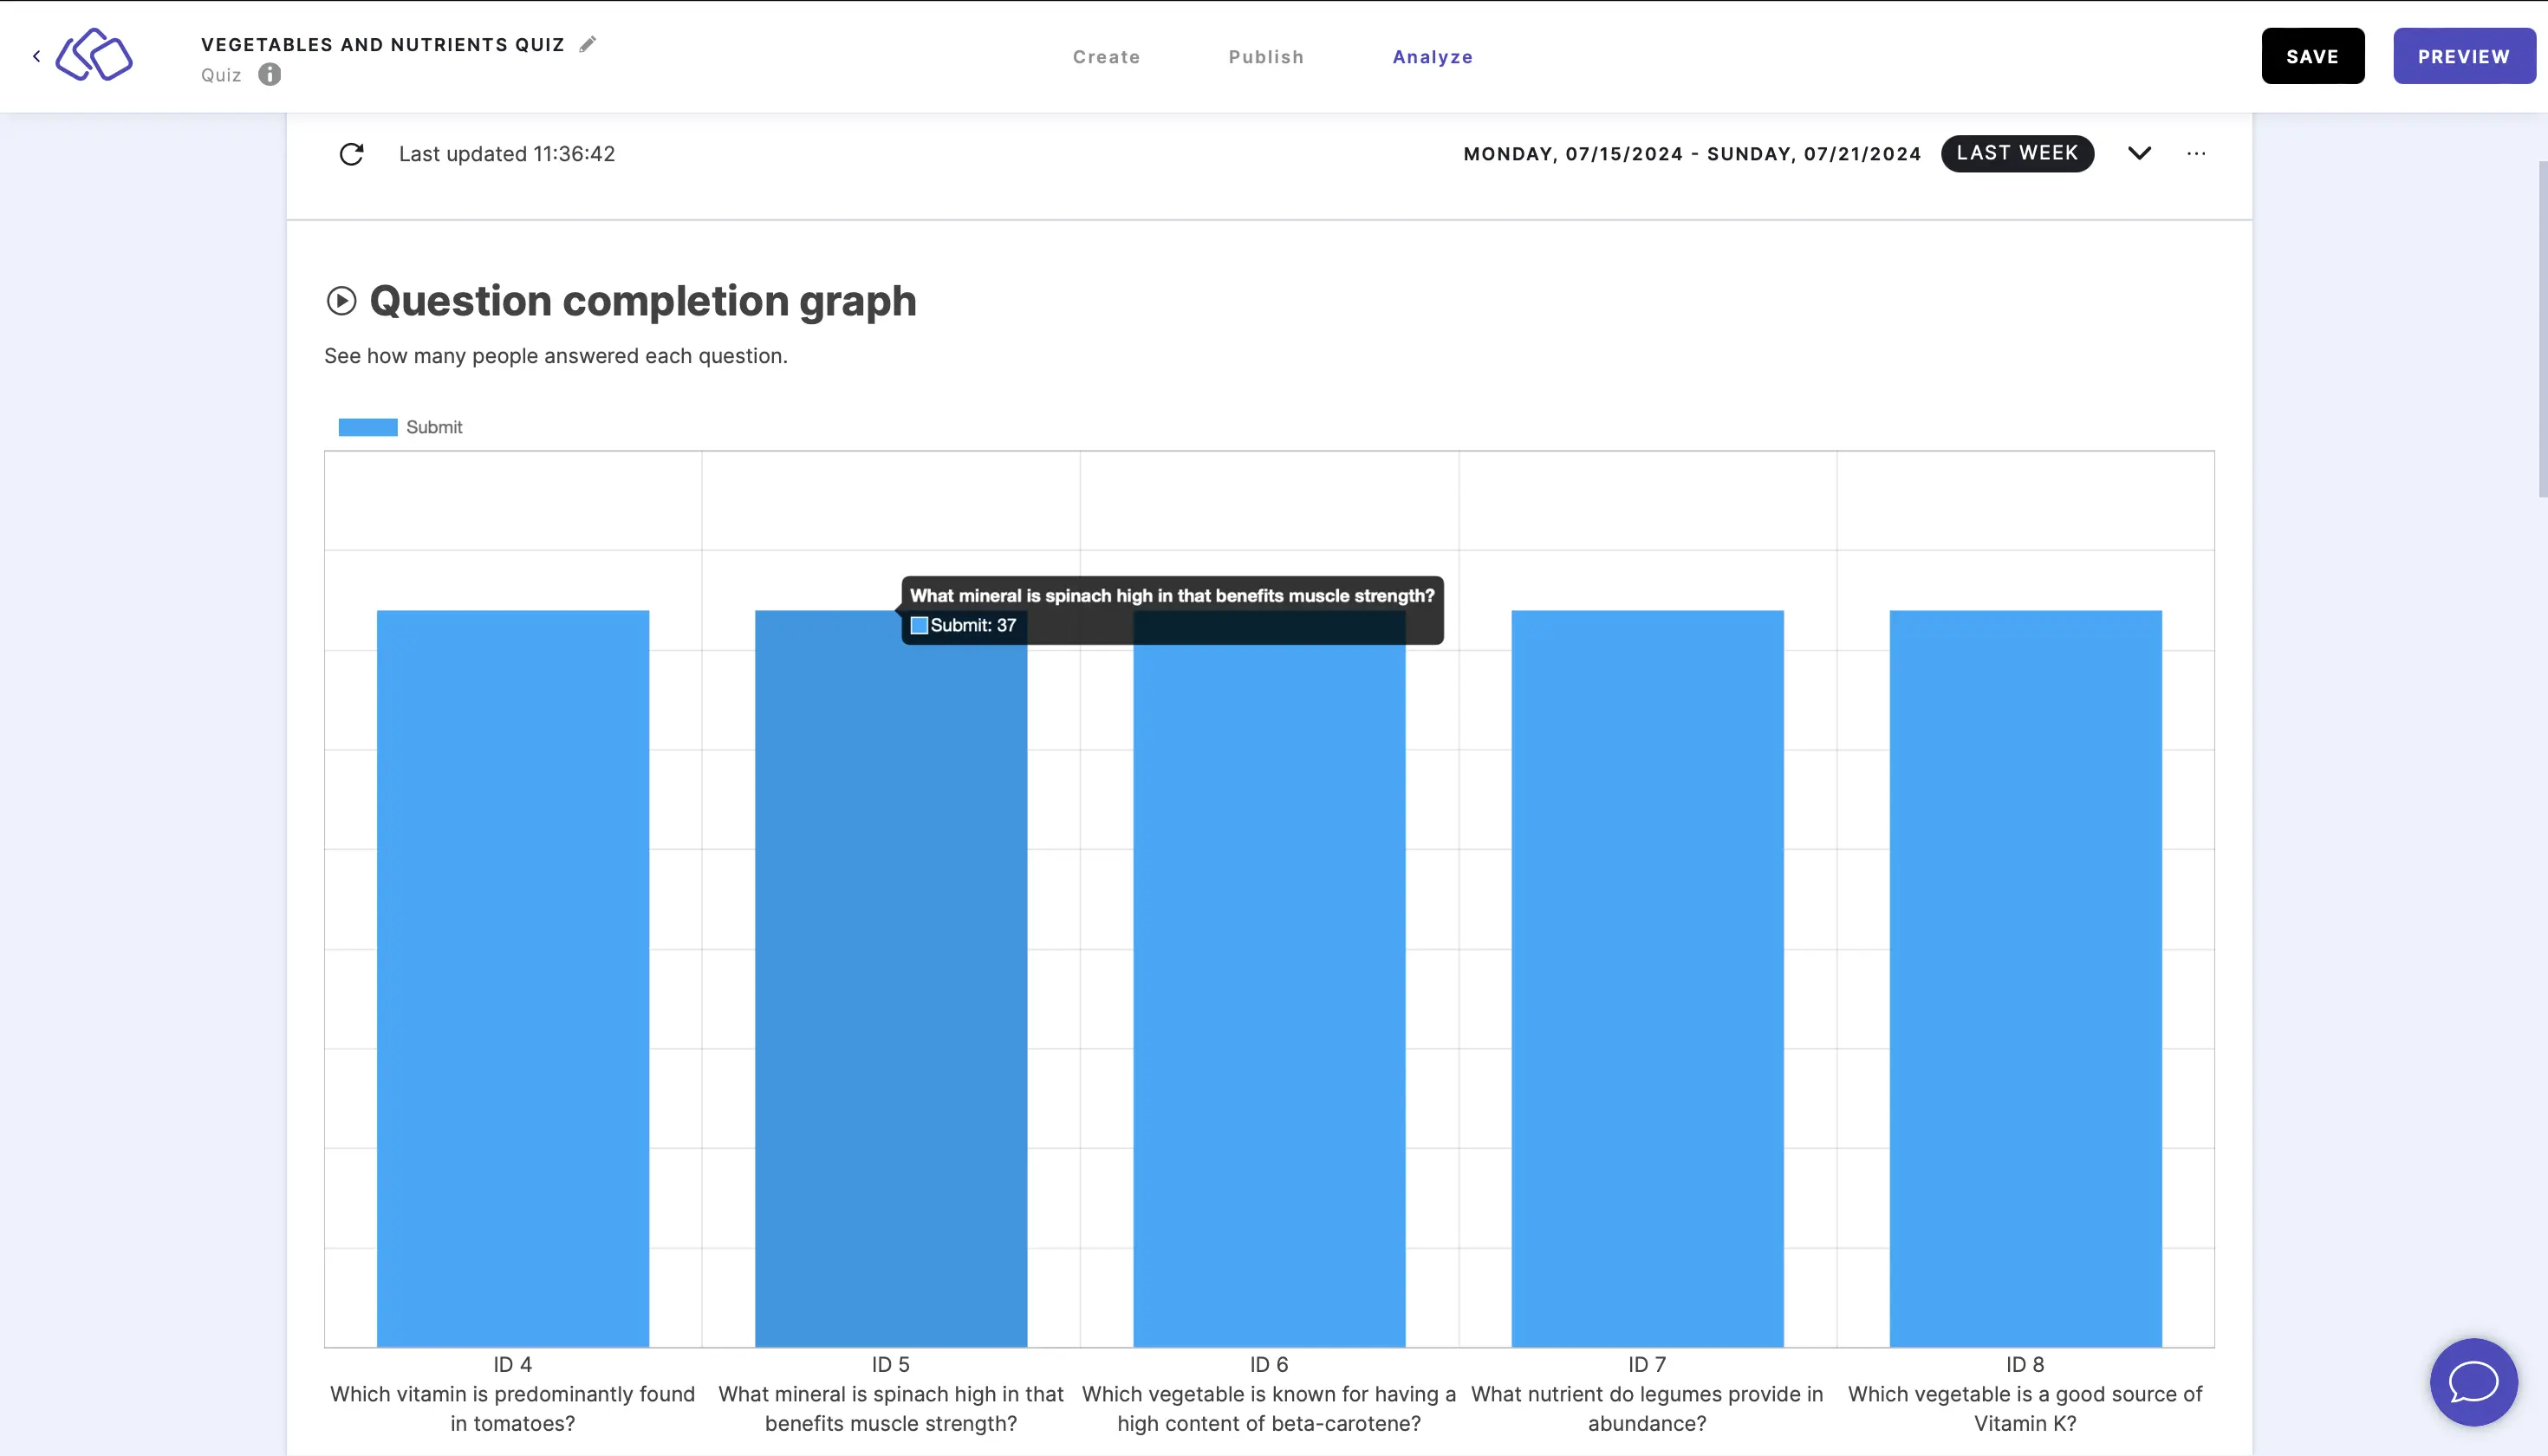
- Look at the bar chart to see which questions were submitted.
- Hover over any bar on the chart to see how many people submitted an answer for any given question.
- The default view and time range is set to current week. To view live stats, click on the down arrow on the right and click on LIVE STATS. As soon as the Riddle is viewed or played, all associated statistics will appear on this dashboard here as they come in without refreshing the page.
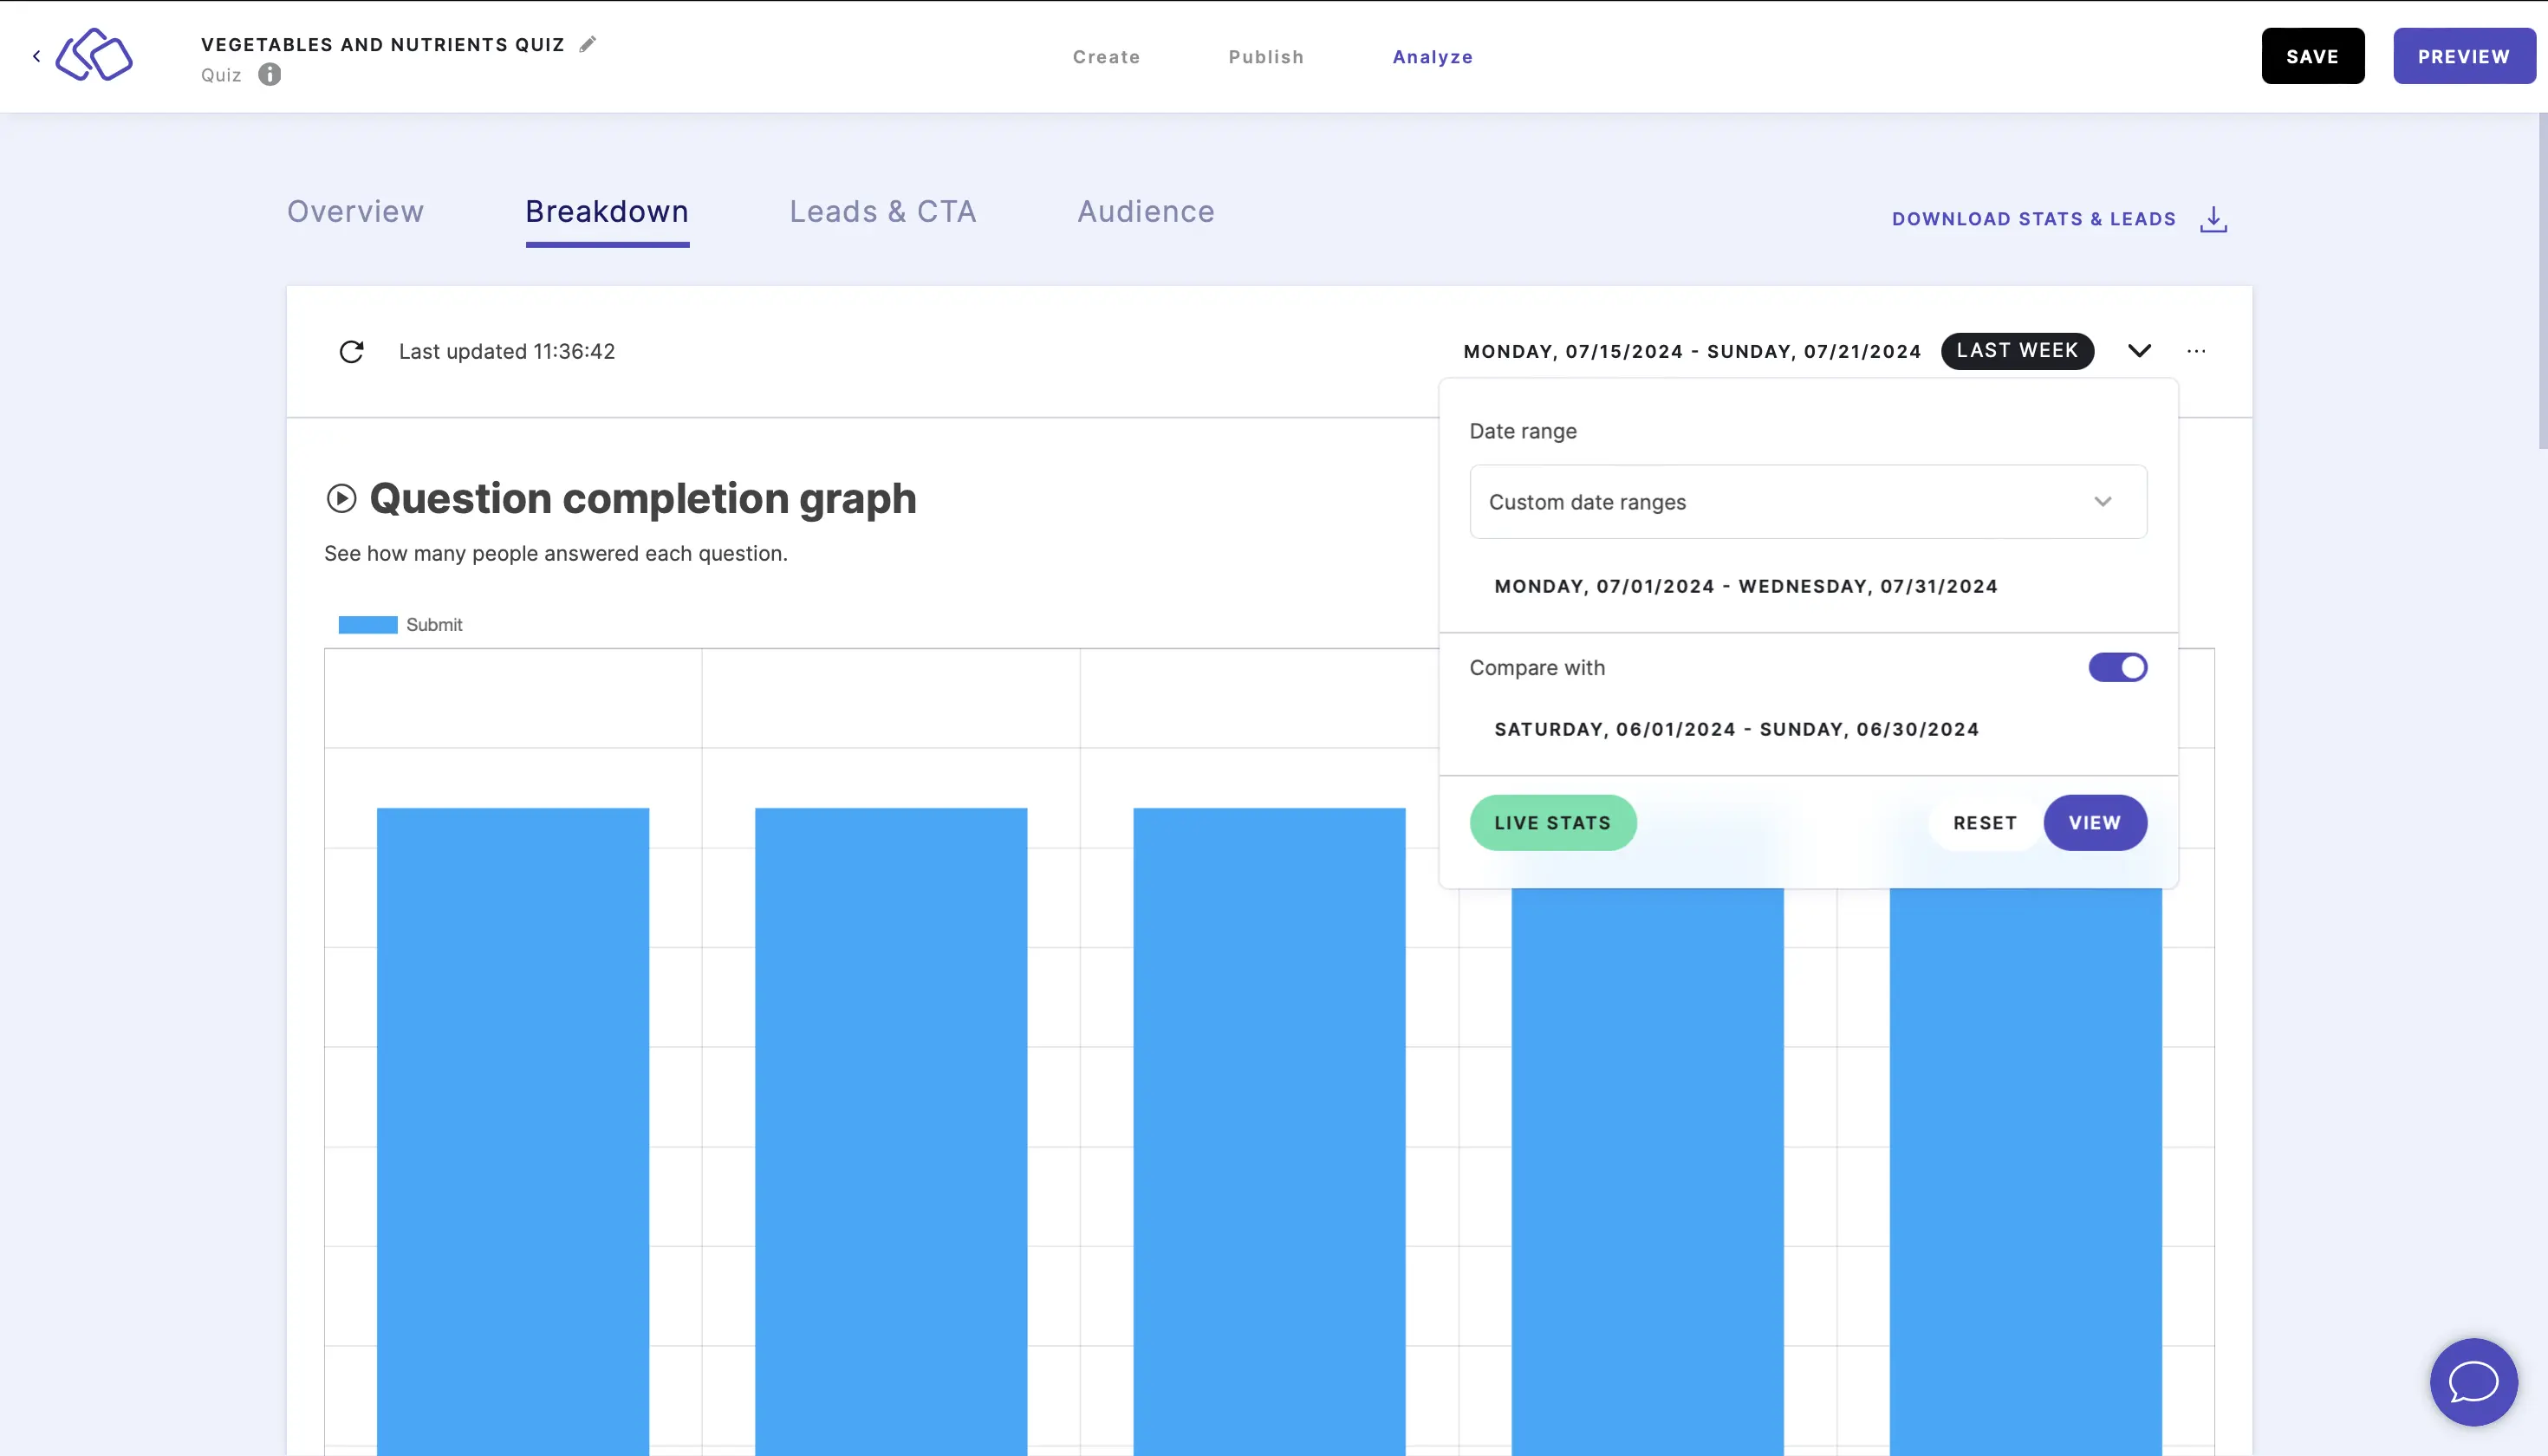
- To filter the stats to a specific time frame, click on the down arrow on the right, select a date range, and click on VIEW.
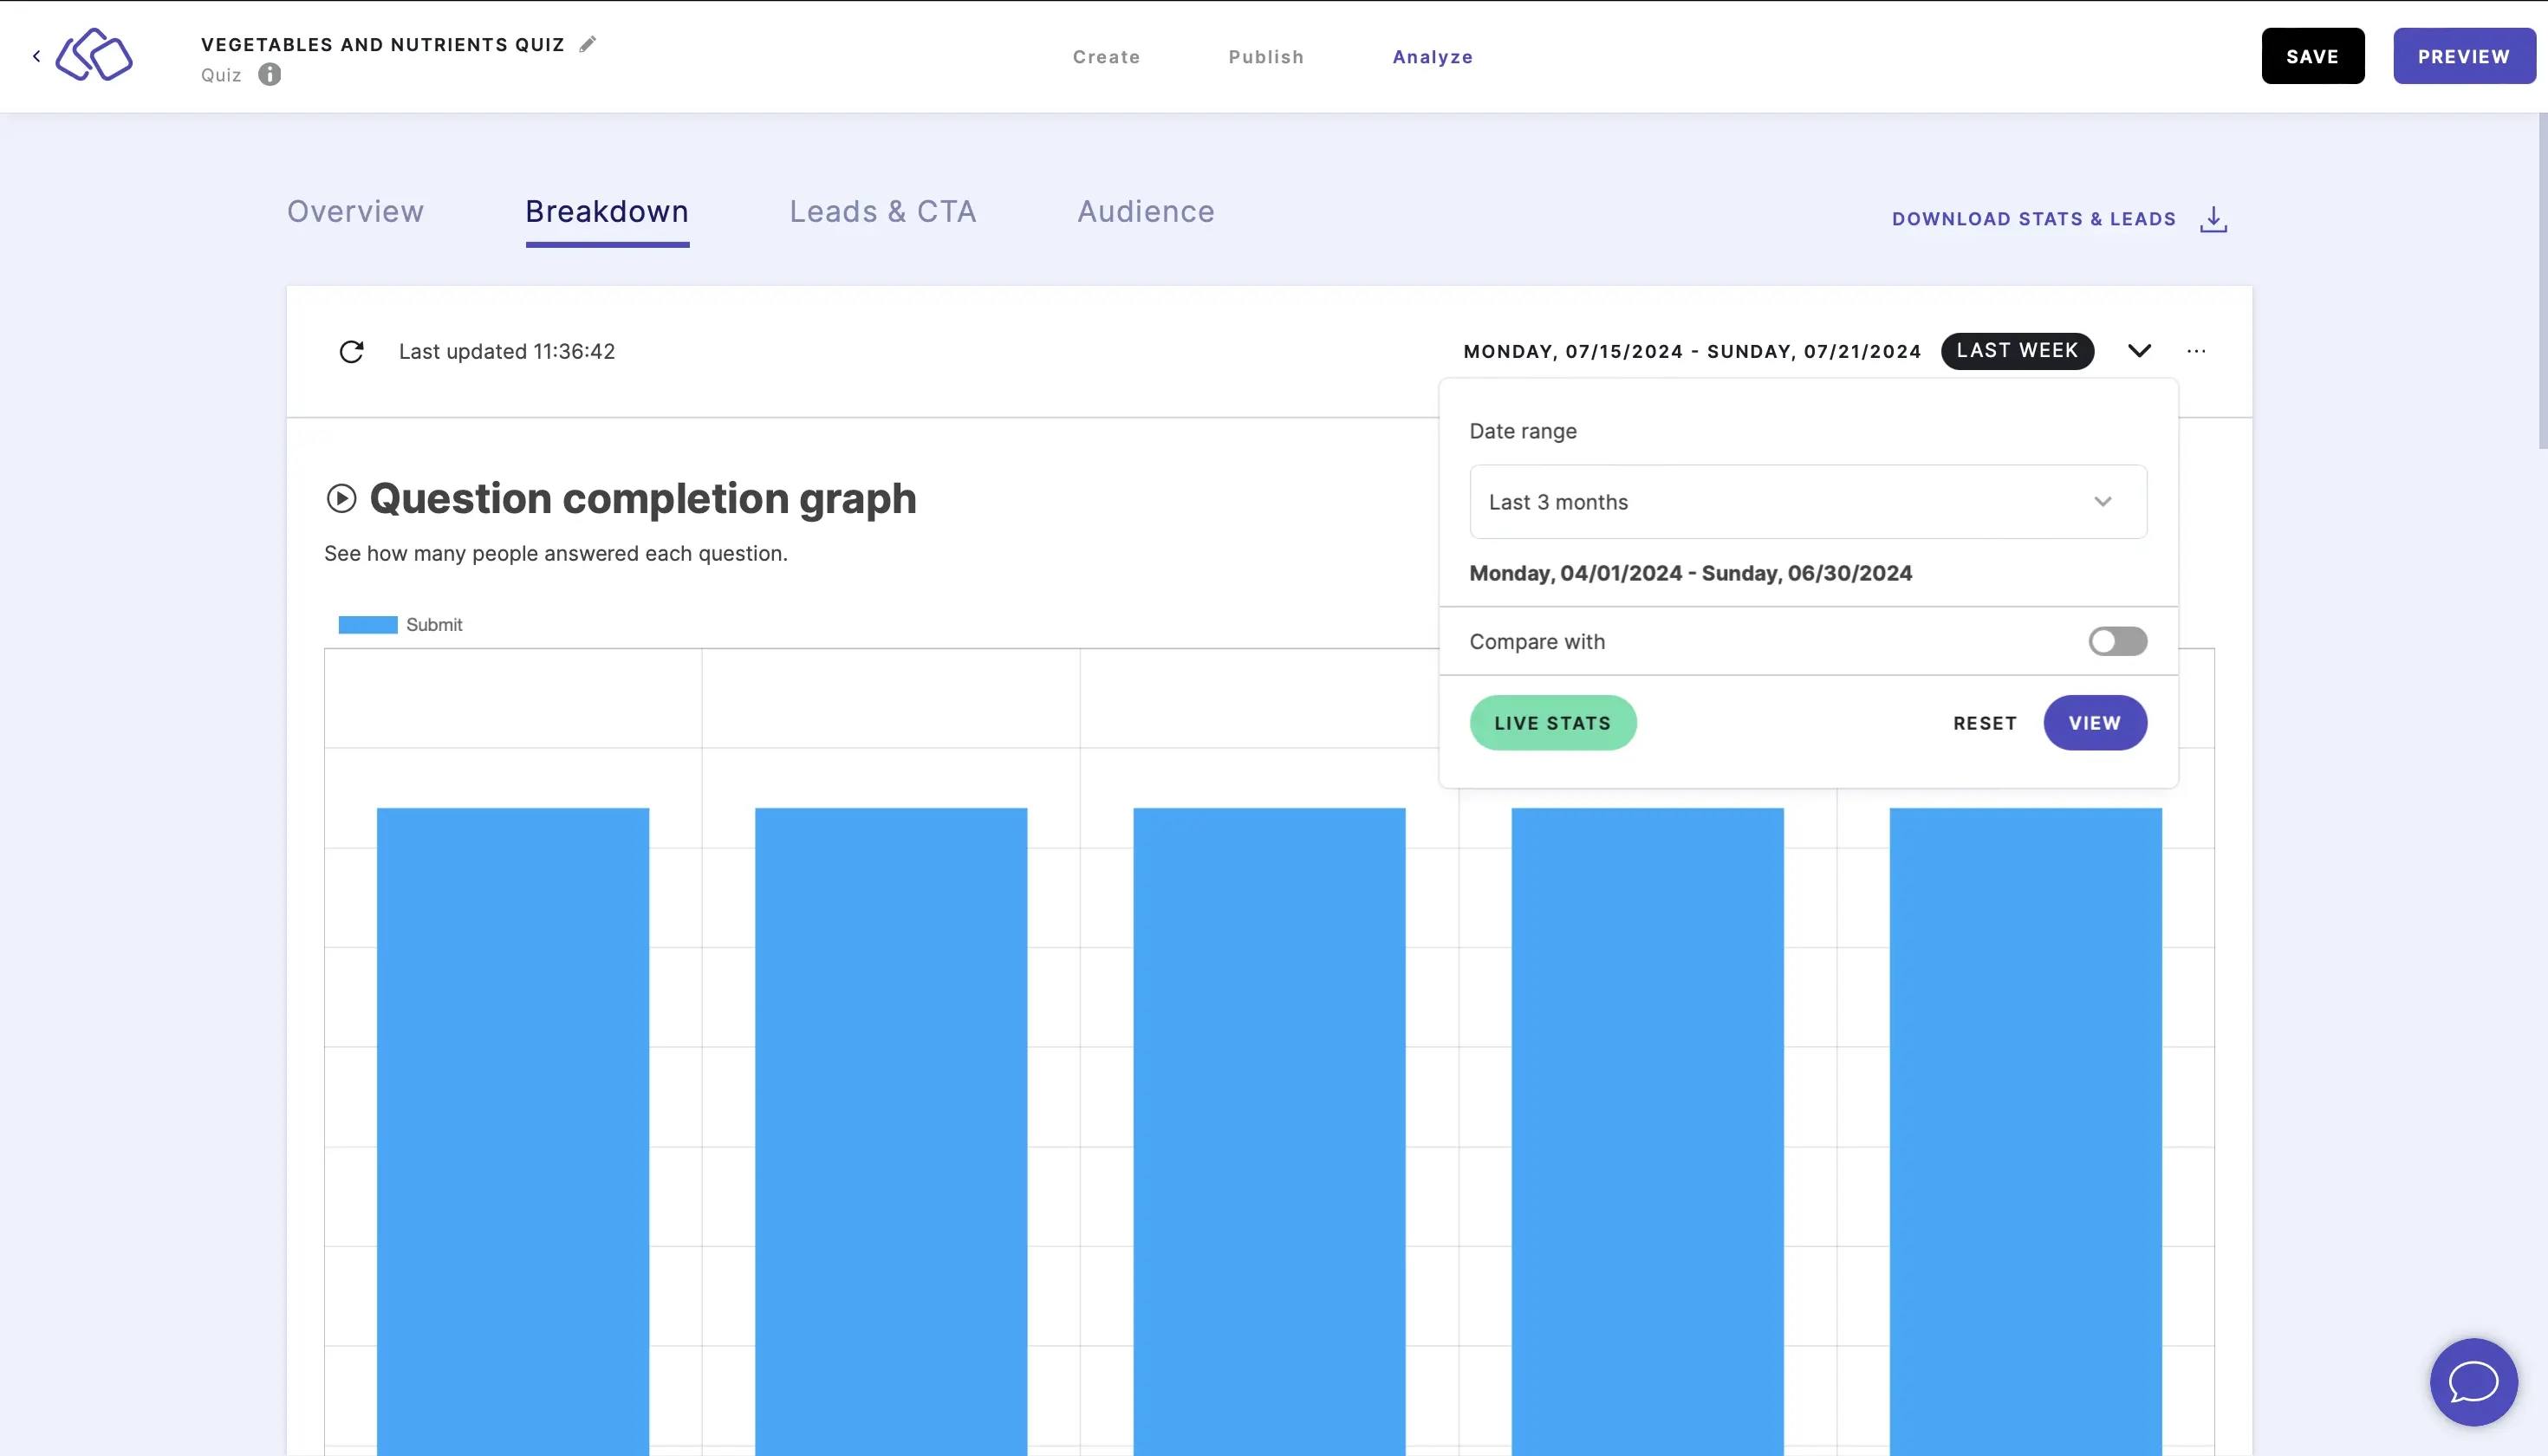
- To compare two custom time ranges, click on the down arrow on the right, select and input Custom date ranges, enable Compare with, and click on VIEW.

- To delete stats, click on the three dots on the right, click on RESET STATS, and in the pop-up that appears select the checkbox and click on OK.
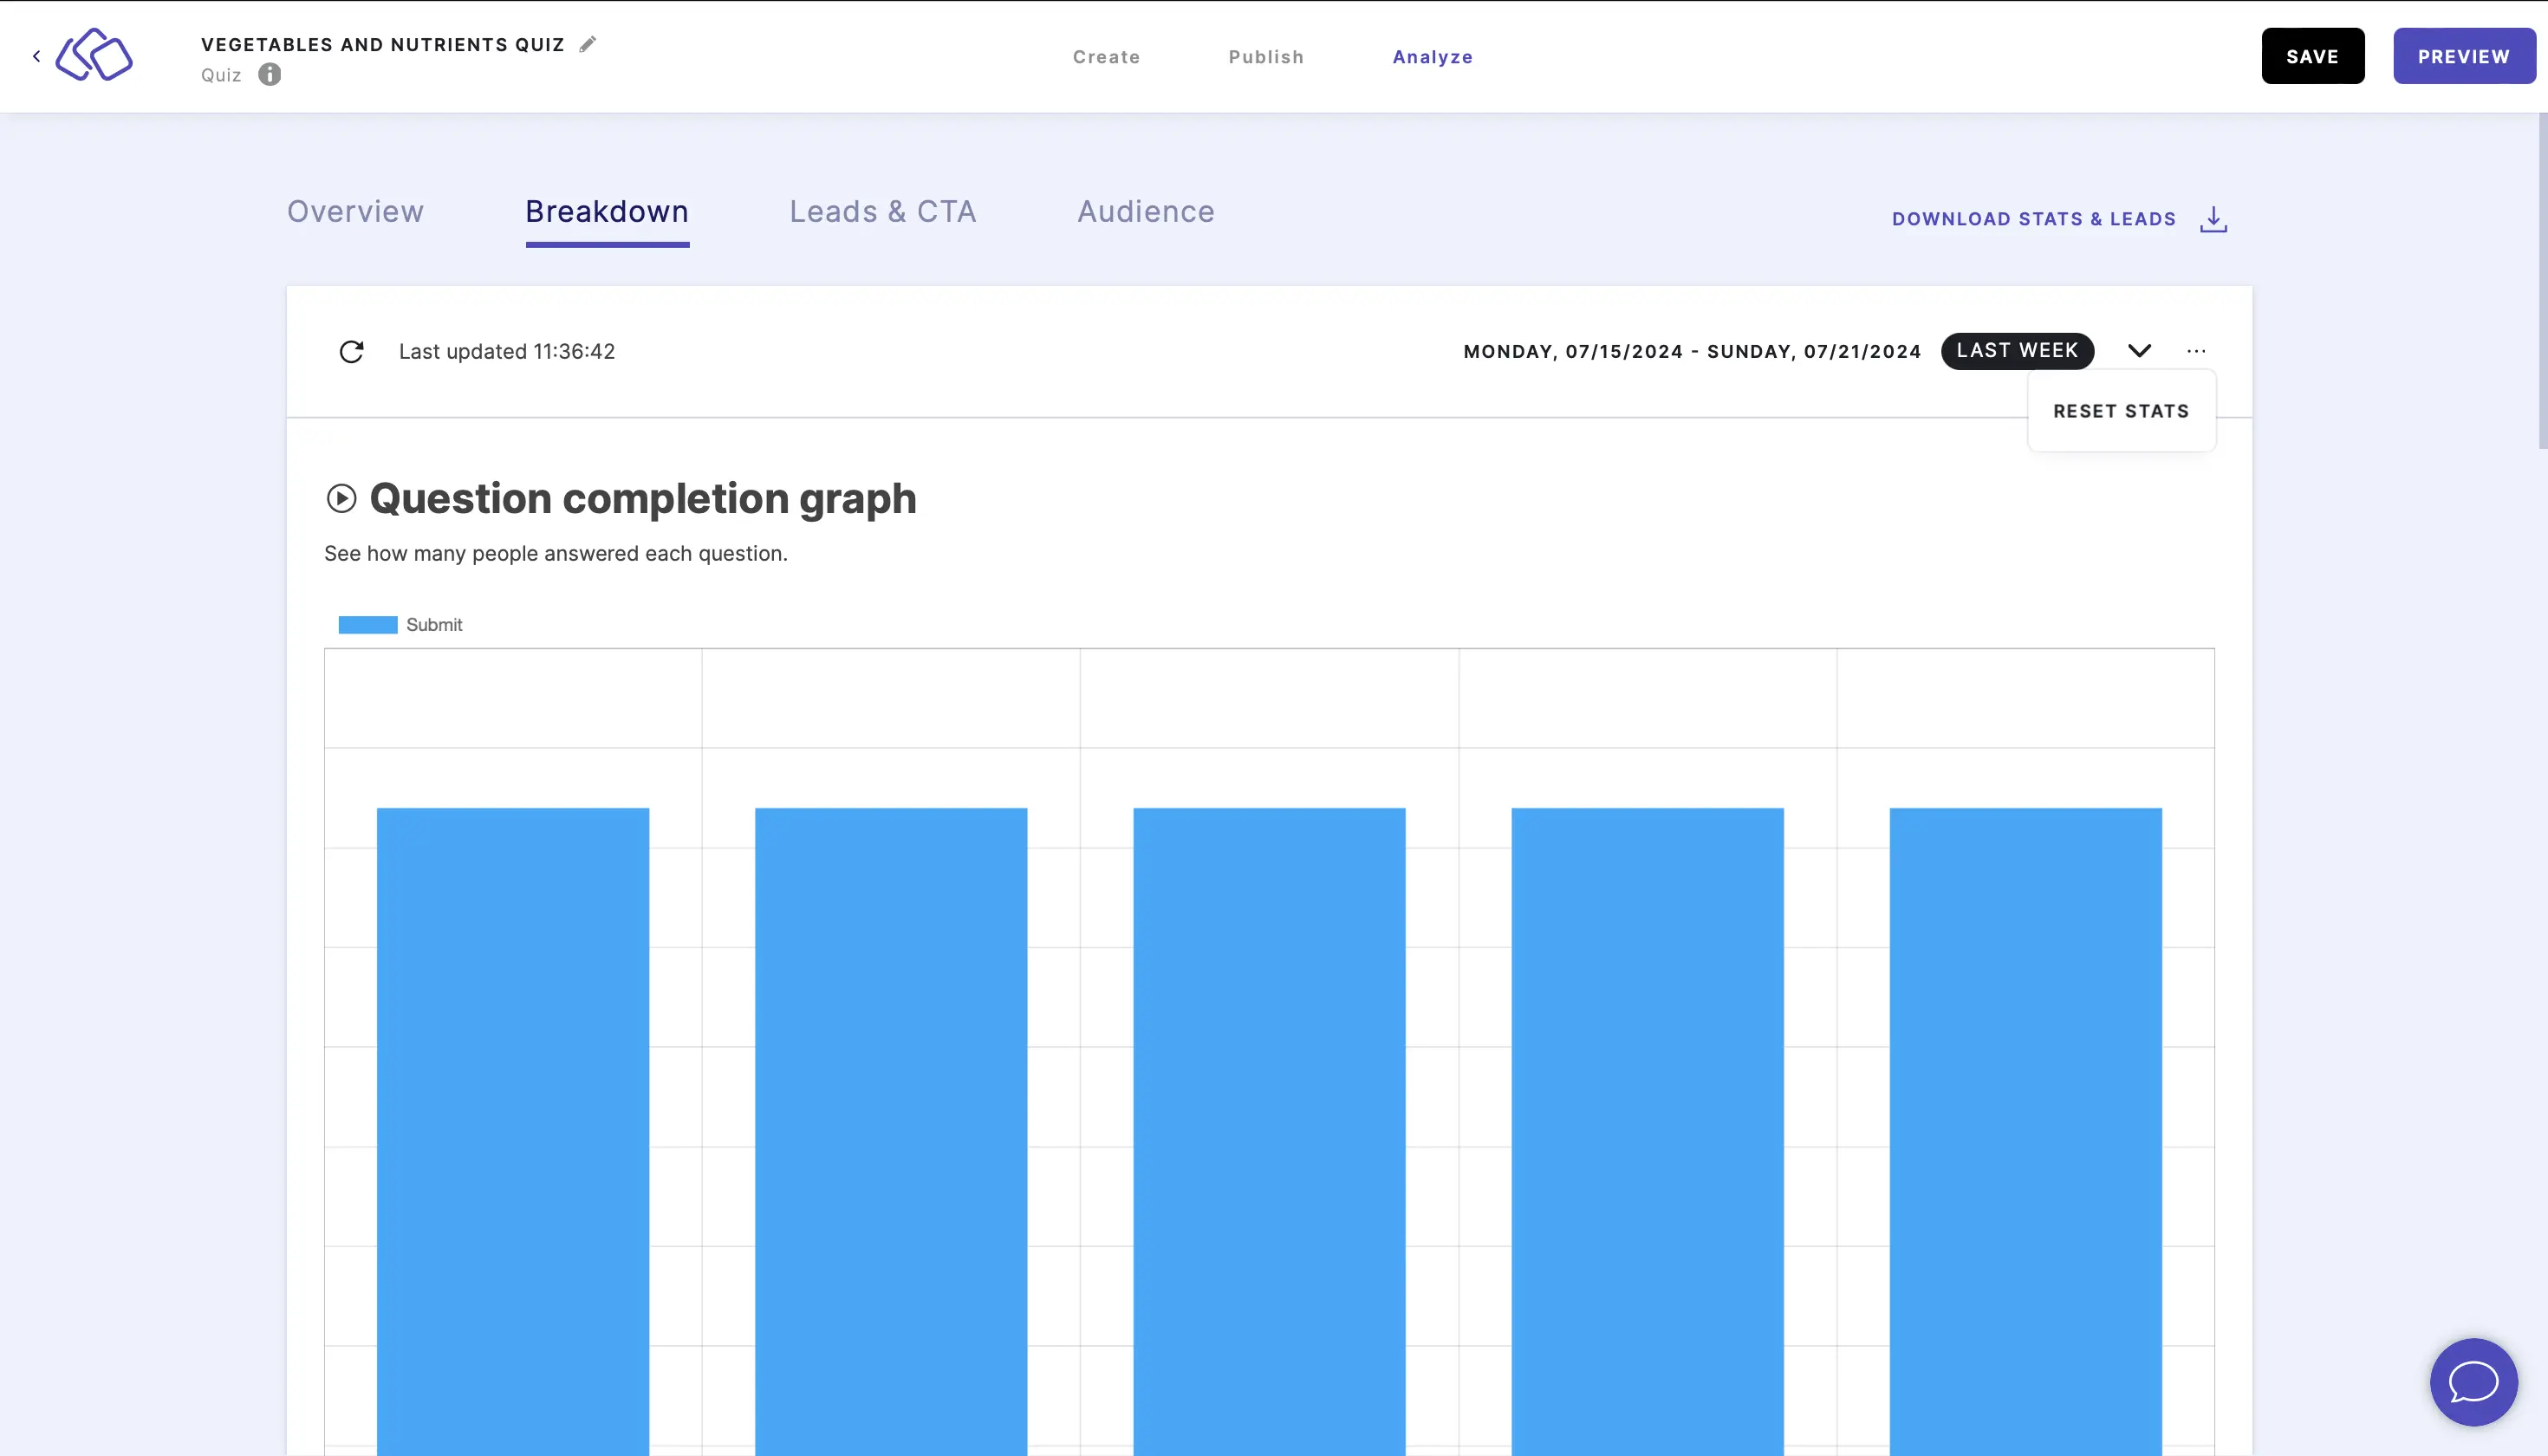
Caution: This will delete all stats for this Riddle.
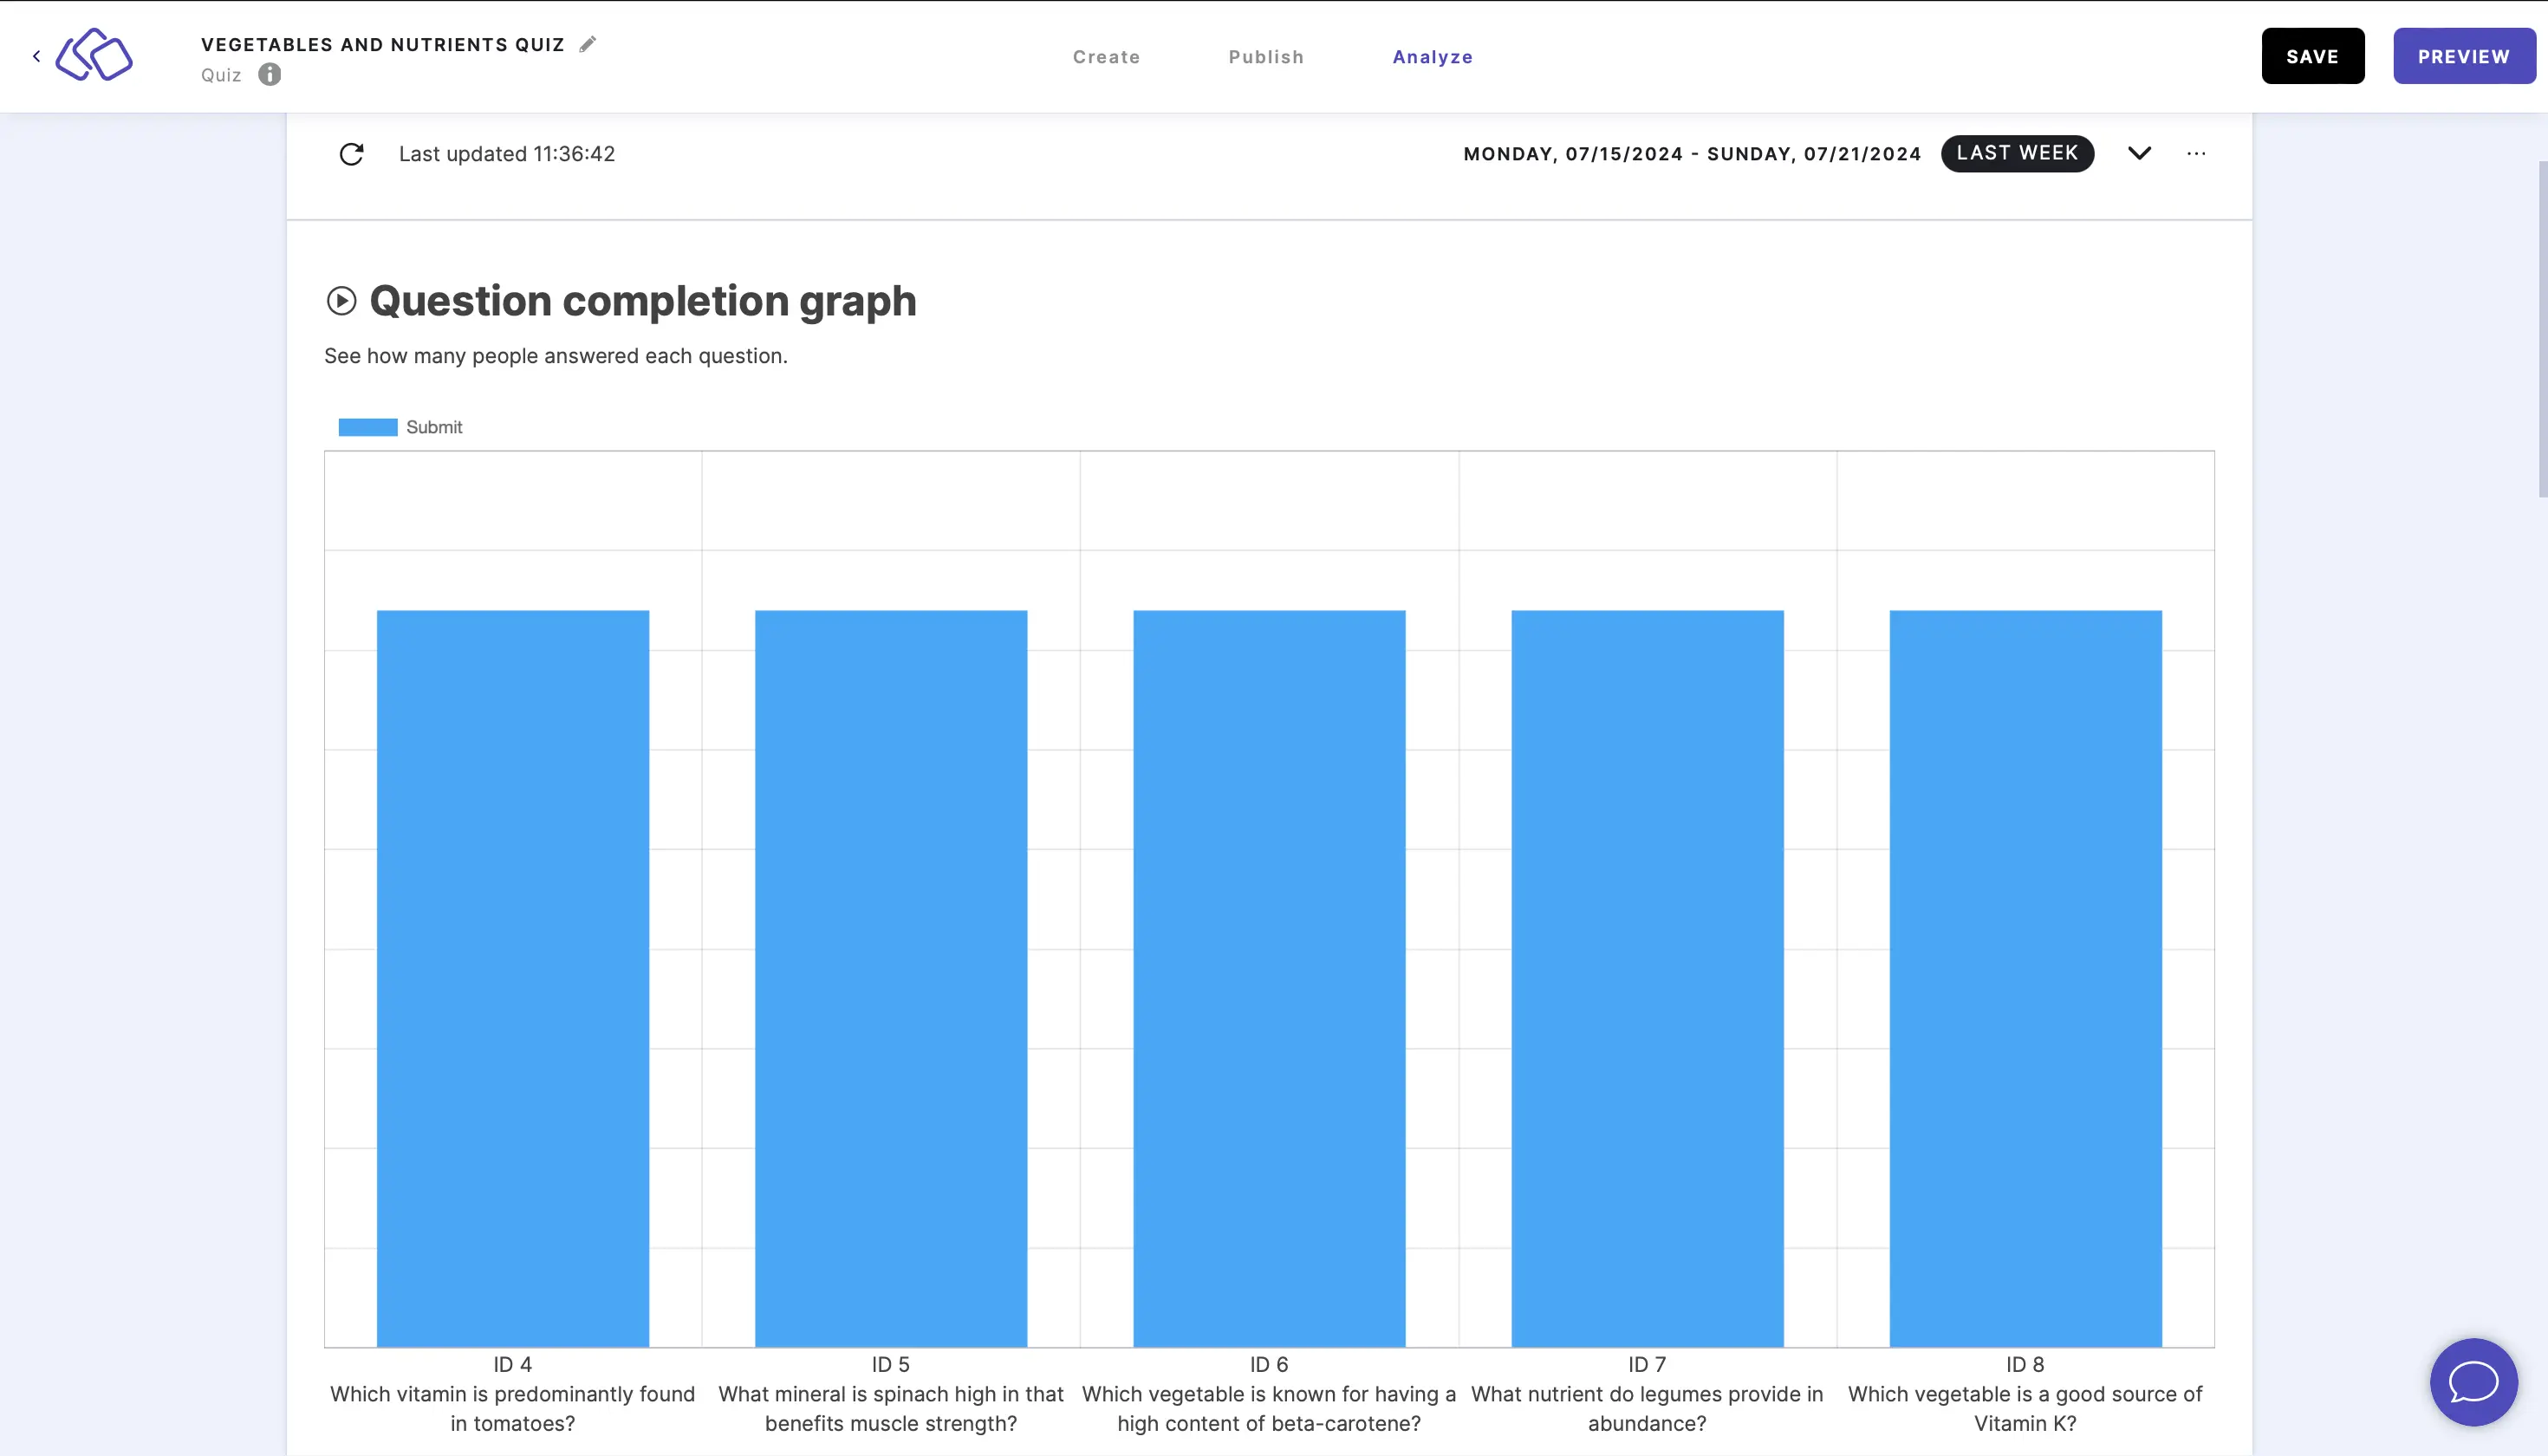
Understand the question completion graph
The question completion graph is a breakdown of submits per block, regardless of which answer was given.
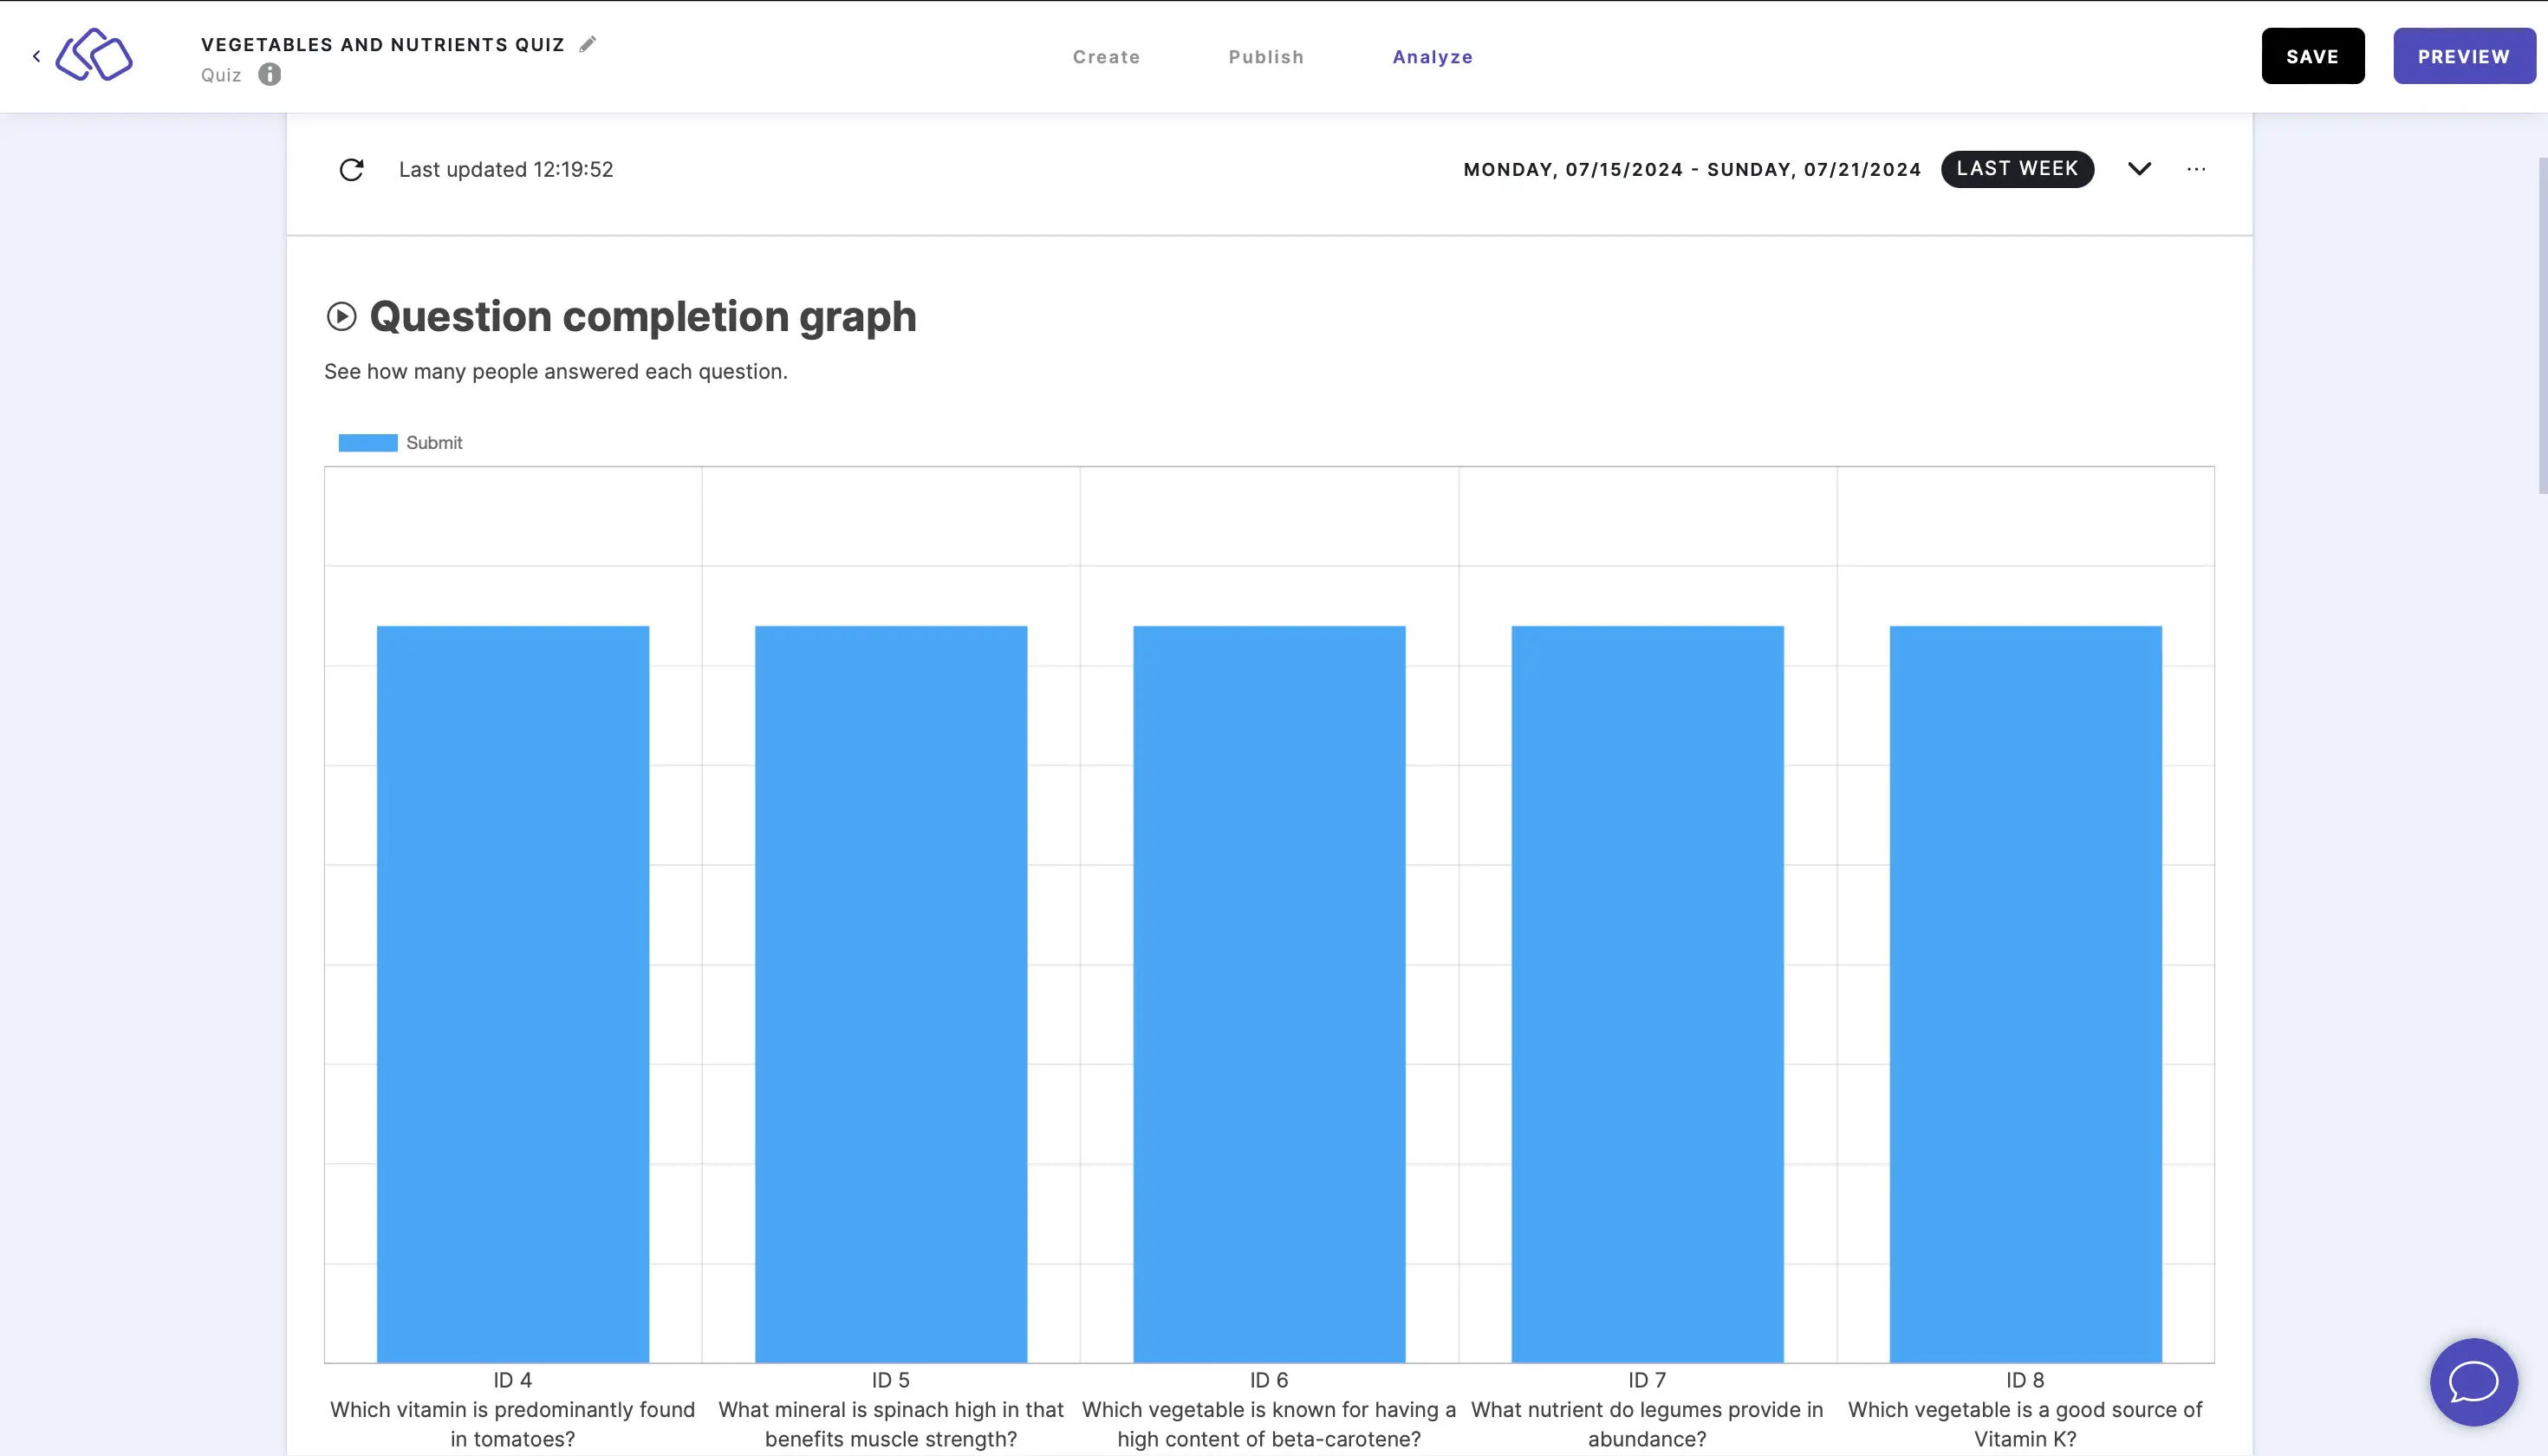
The ID number refers to the ID assigned to that Riddle block.
The blue bars indicate submitted blocks. The red bars indicate skipped blocks.
Understand the answer breakdown
The answer breakdown is your audience's answers for each block, split into a question-level stats and a right / wrong breakdown.
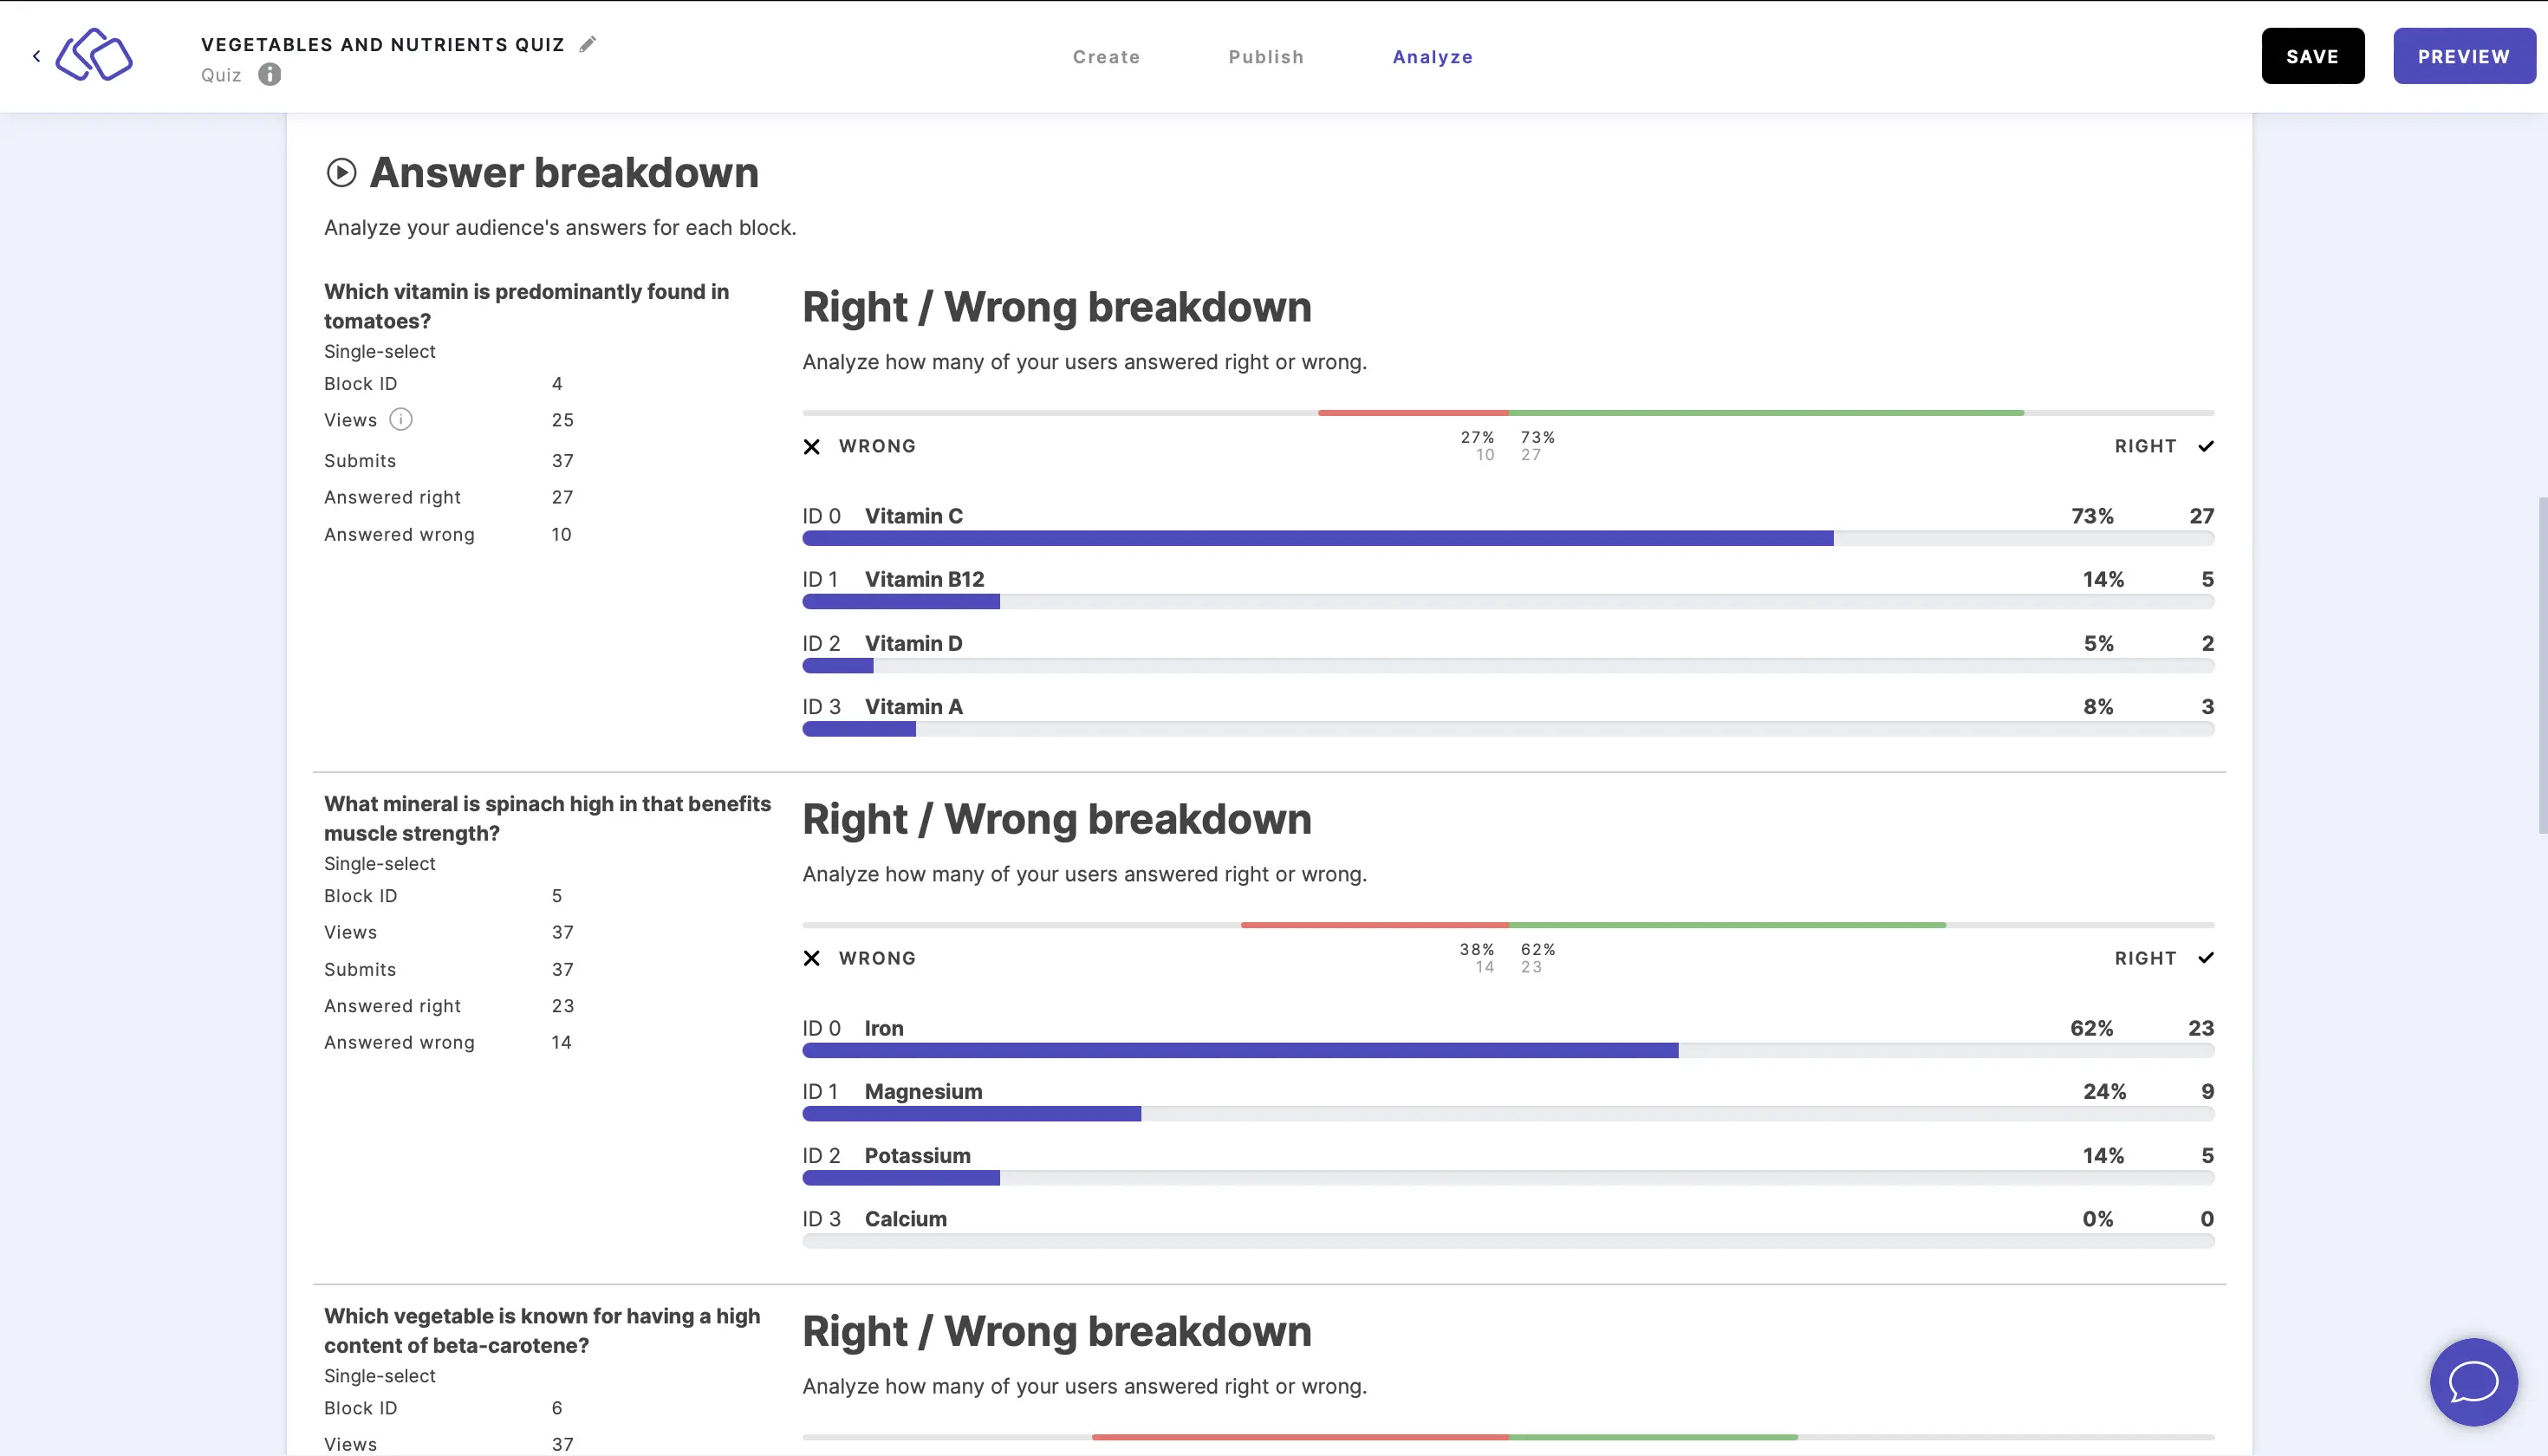
- Question information shows the following:
- Block title
- Block type
- Block ID
- Views - how many times the block was opened including repeat openings by the same person
- Submits - how many times someone clicked on the 'Submit' (or your customized equivalent) button
- Answered right
- Answered wrong
- Skips (where applicable) - the number of times someone clicked on the 'Skip' button.
- Right / Wrong breakdown shows the following:
- The number and percentage of people who got the question wrong or right
- The number and percentage of people who submitted an answer, each with their answer ID and answer content
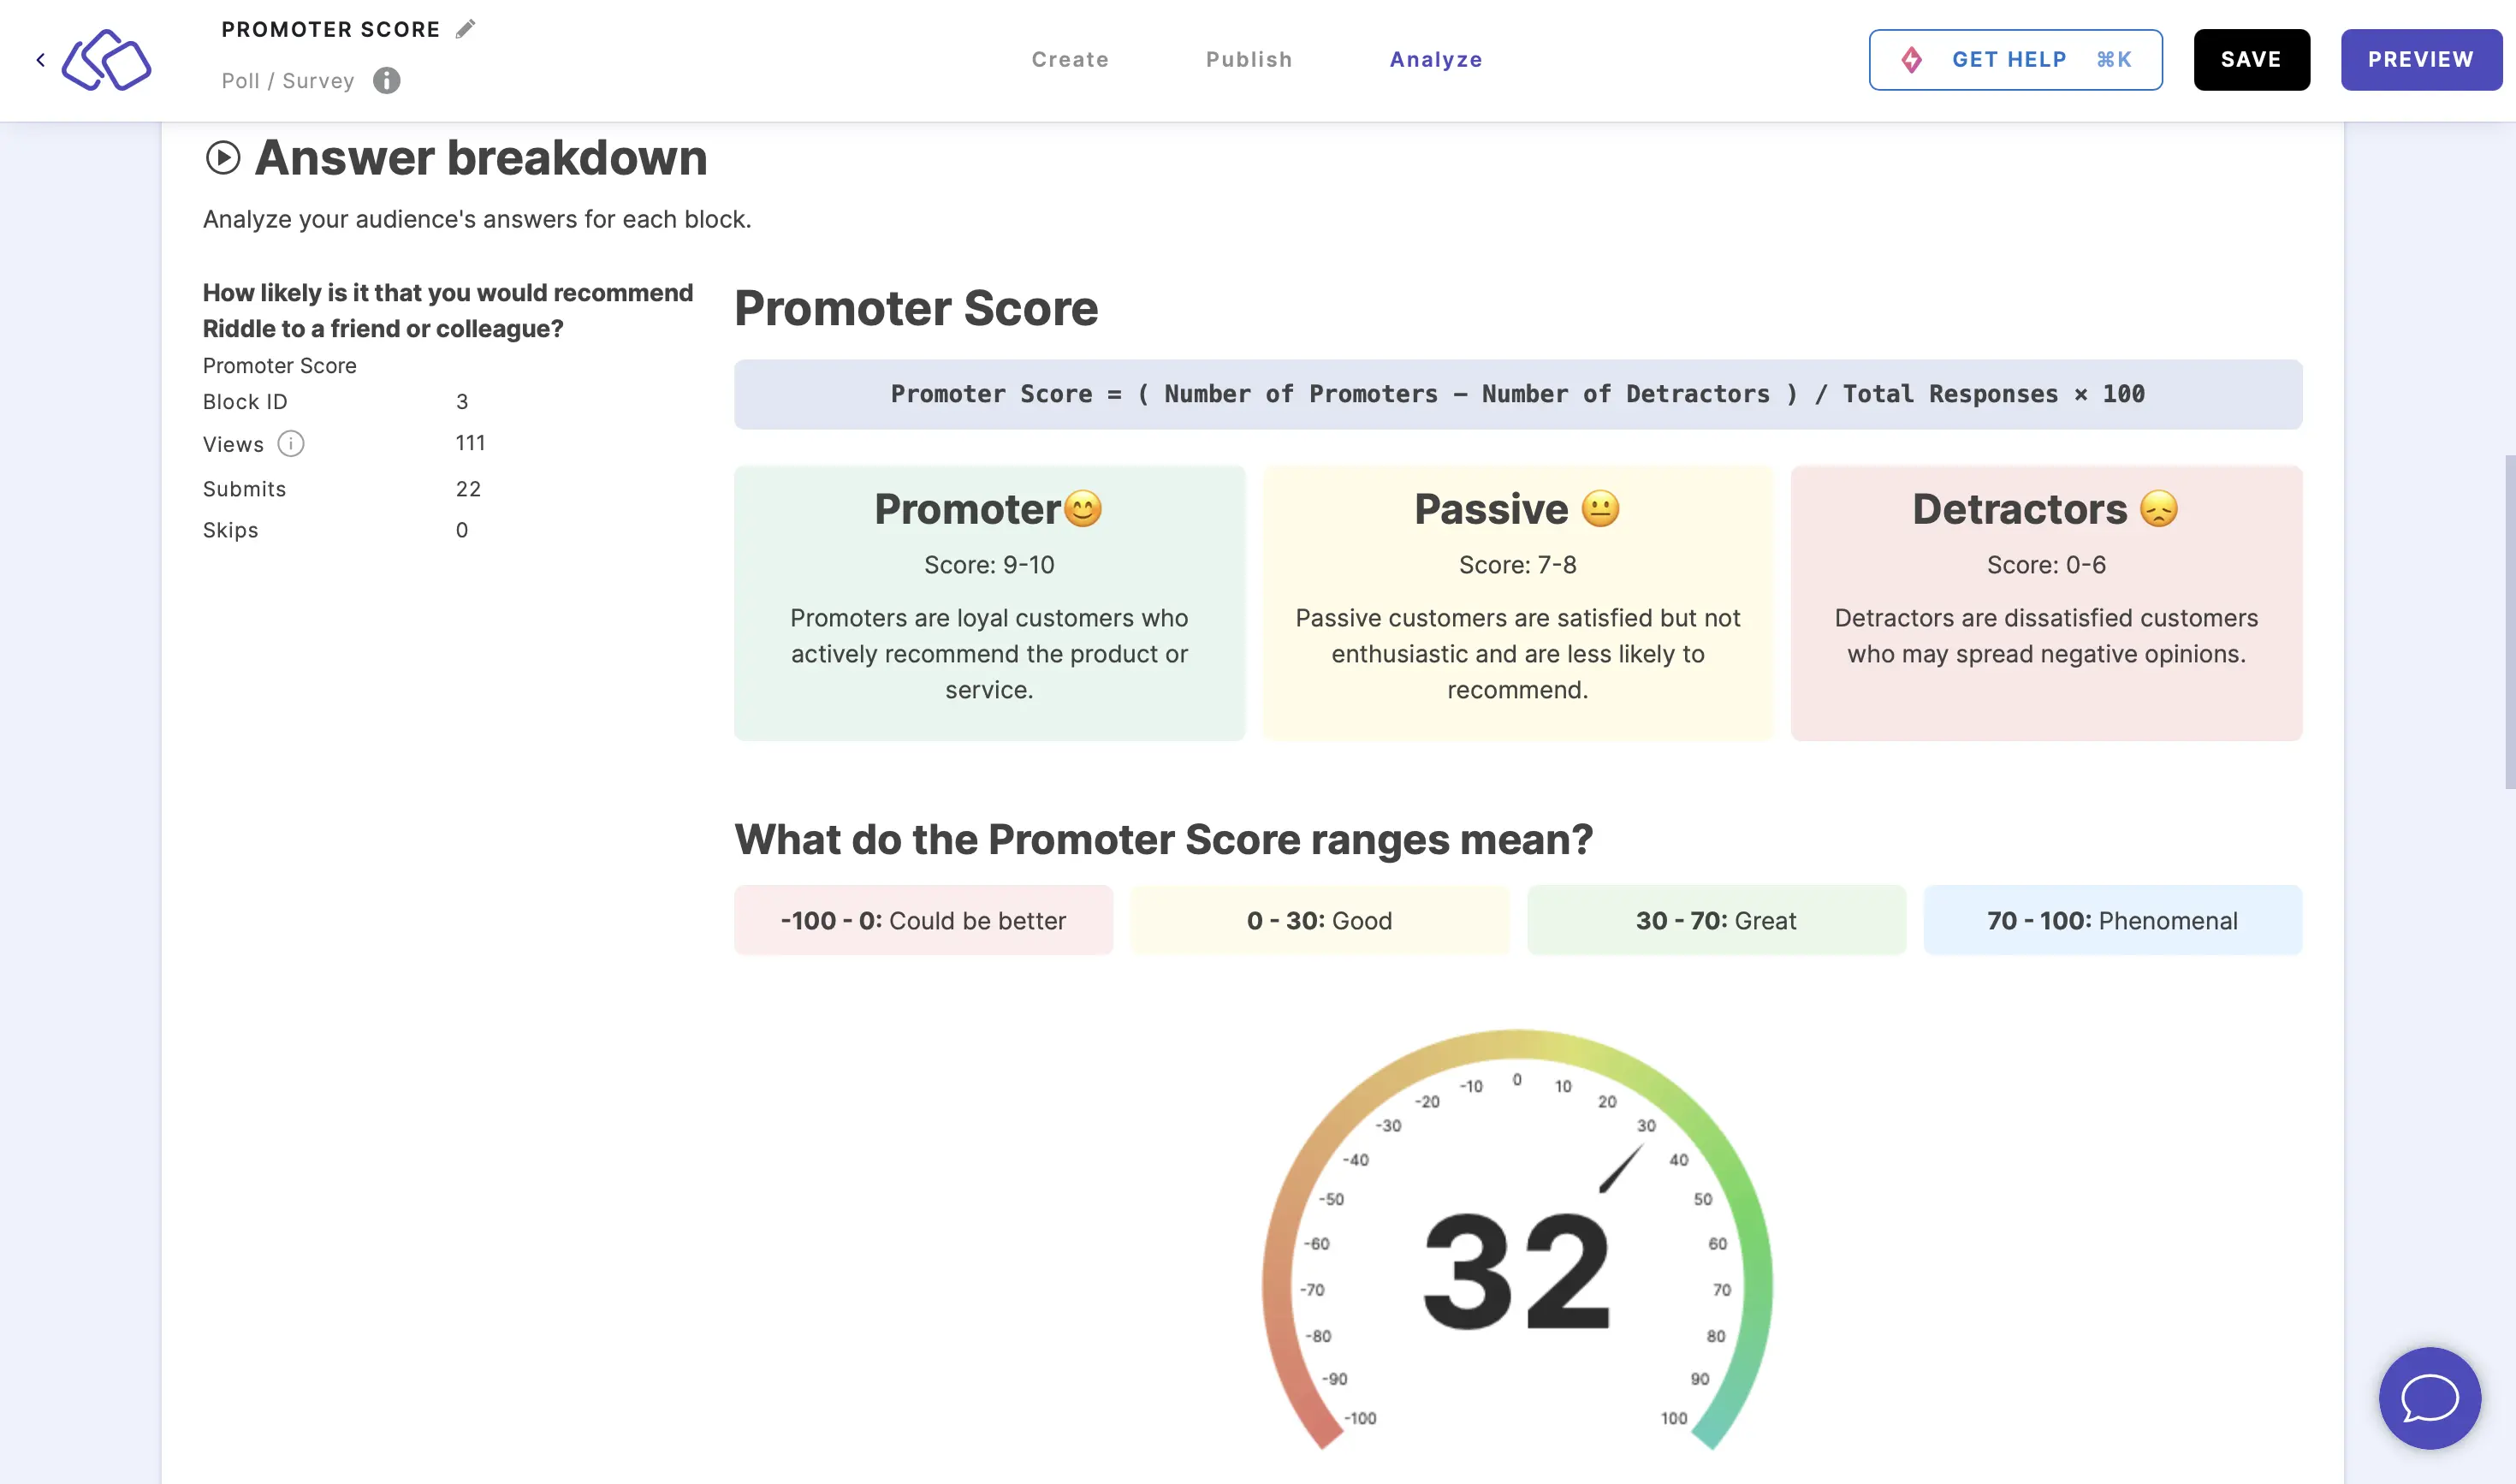
- Your Promoter Score shows the following:
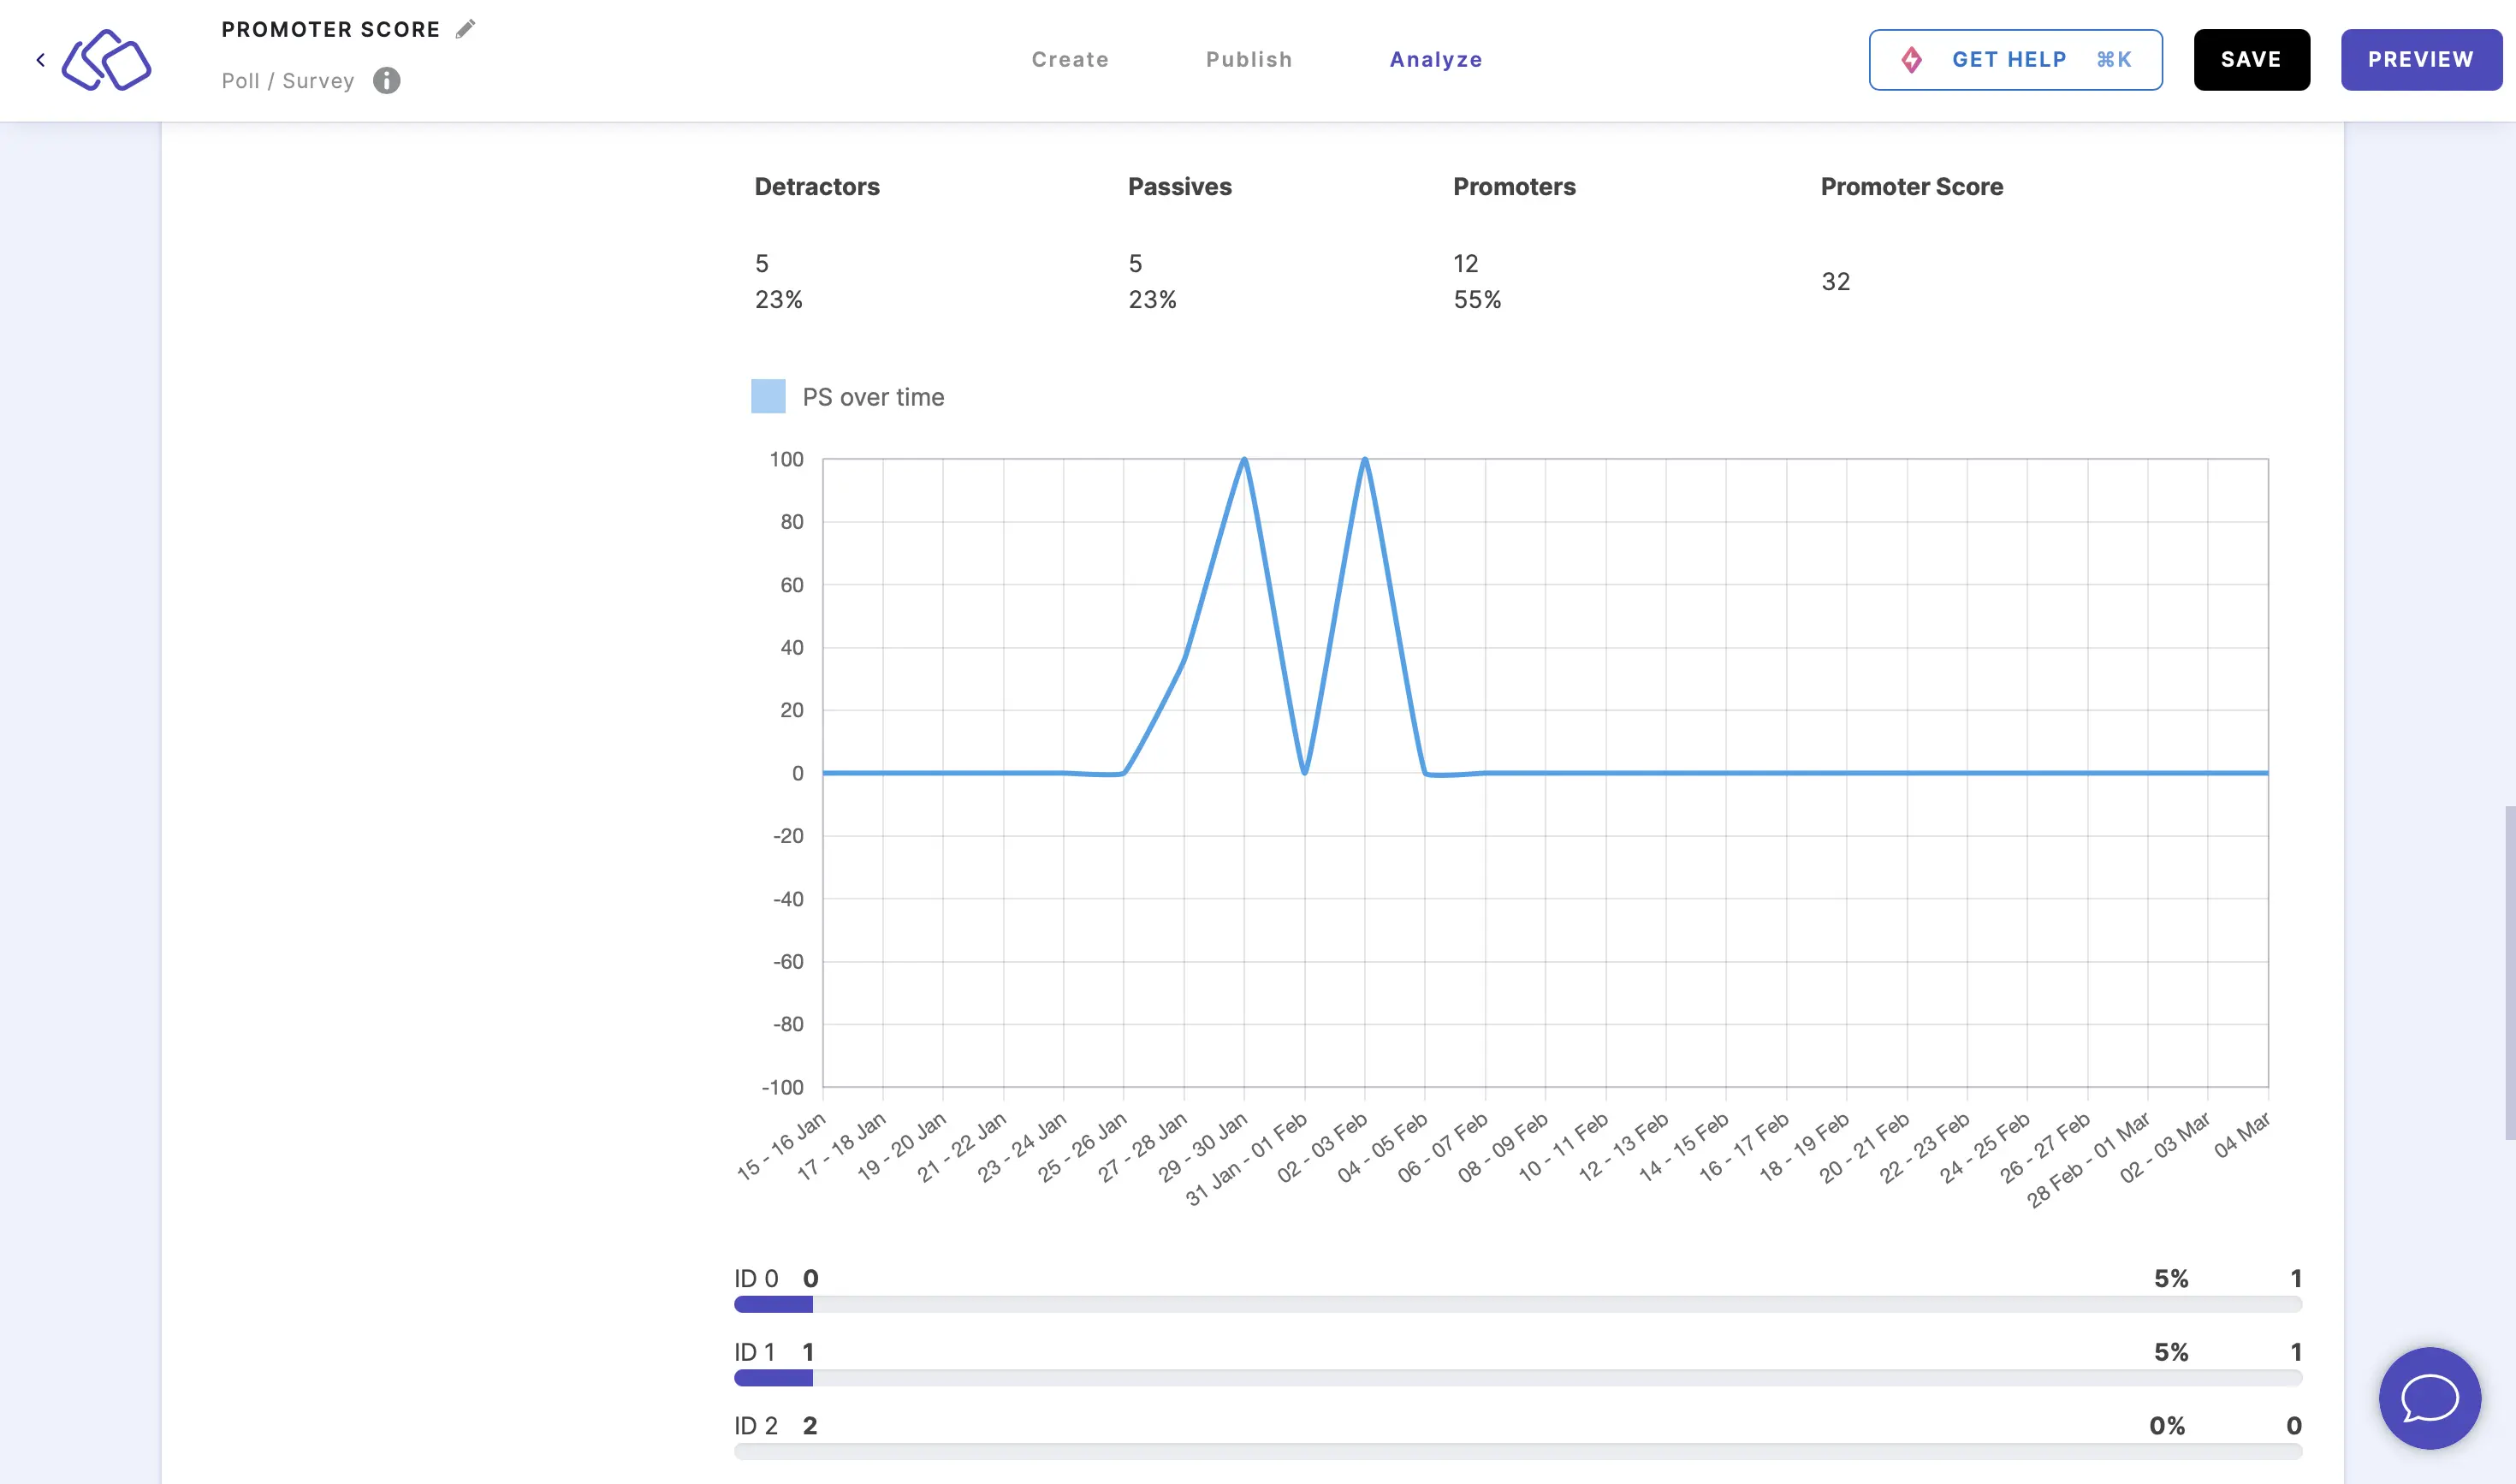
- The overall number and percentage of detractors, passives, promoters, and overall Promoter Score as a speedometer gauge and graph.
- The number and percentage for each score on the scale, each score labelled with the corresponding ID number.
- The overall number and percentage of detractors, passives, promoters, and overall Promoter Score as a speedometer gauge and graph.
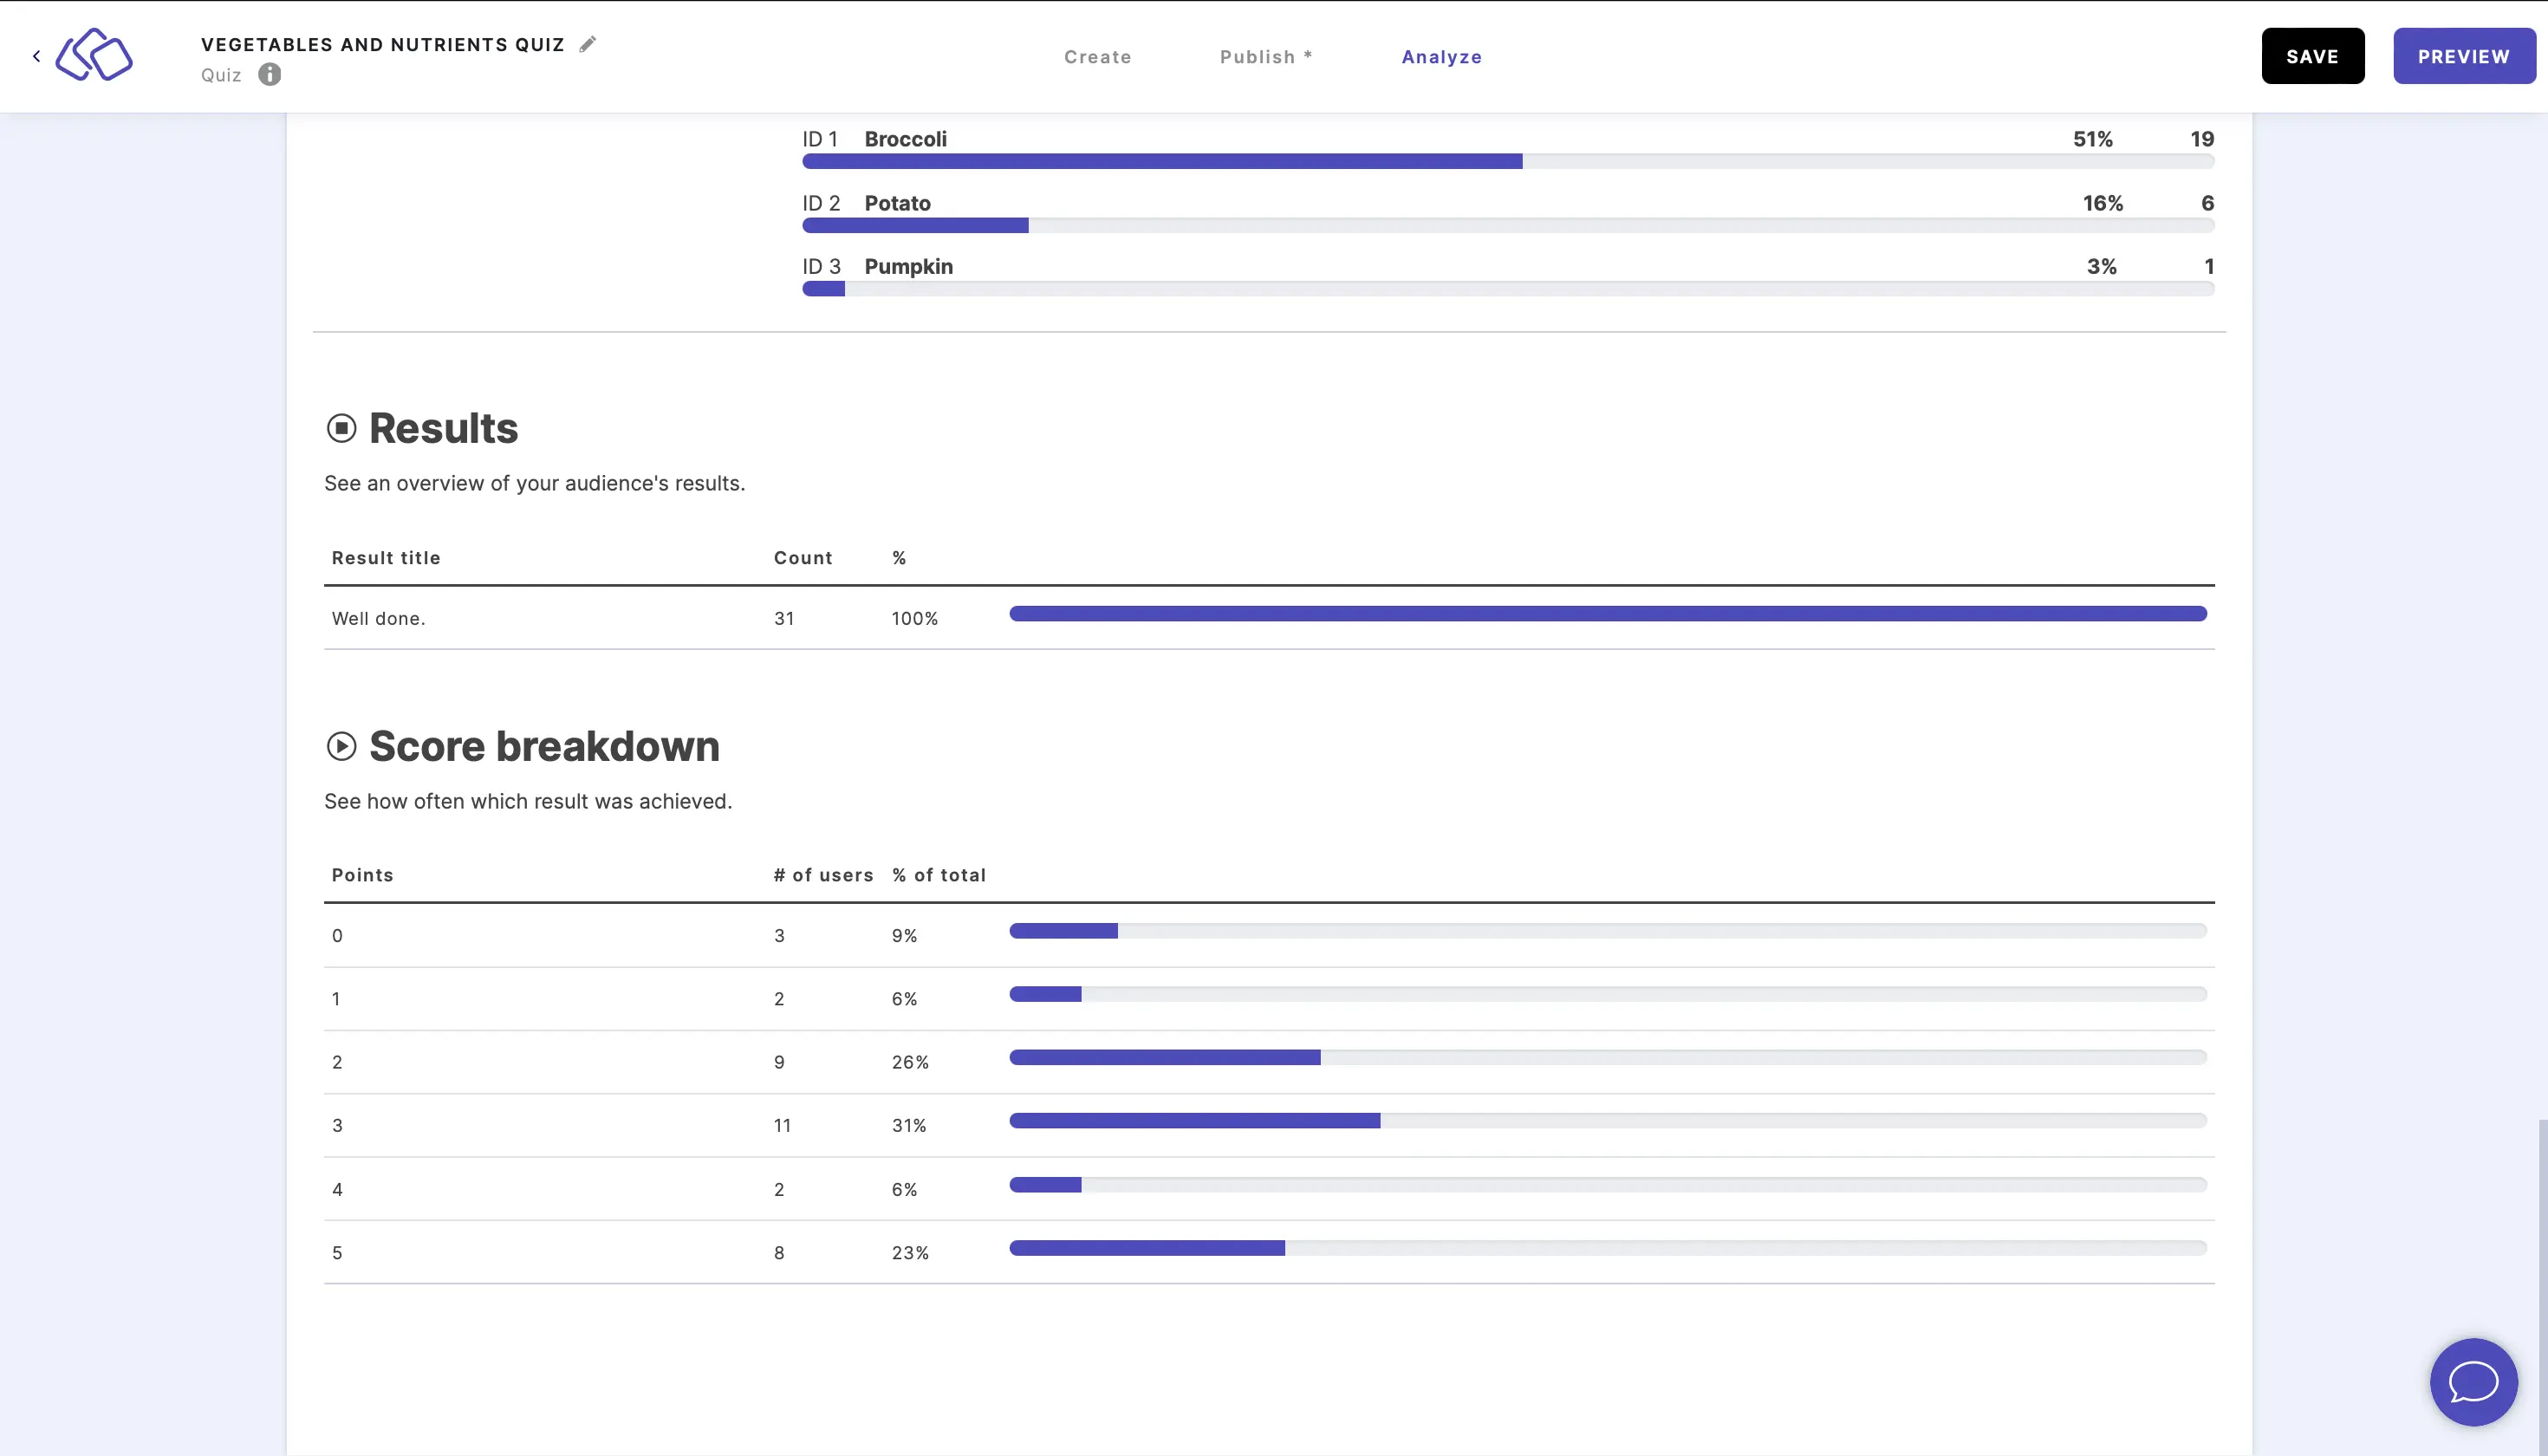
Understand results
Results are the number and percentage of your audience who got each result title.

Understand score breakdown
Score breakdown breaks down the number and percentgage of people who got each possible outcome of points.